Chandan Gupta
Chandan Gupta

Author
- Mar 24, 2025 20:01 UTC
-
Shiba Inu (SHIB) Poised For 50% Rally, Here’s Why

Shiba Inu (SHIB), a popular dog-themed meme coin, has breached its prolonged consolidation and a major resistance level, positioning itself for massive upside momentum. As of today, March 25, 2025, with a 6% upward move, the meme coin is reversing its extended market downturn.
Shiba Inu (SHIB) Technical Analysis and Upcoming Levels
According to expert technical analysis, SHIB appears bullish as it has broken out of a consolidation zone and a descending trendline that has acted as a resistance level since the beginning of January 2025.
With this breakout and an impressive price surge, the meme coin seems to be forming a bullish inverted head and shoulders pattern and is on the verge of another breakout. Experts view this pattern as a bullish signal, indicating a potential recovery of SHIB’s recent losses.
Based on recent price action and historical momentum, if the meme coin breaks out of the pattern and closes a daily candle above the $0.0000138 level, there is a strong possibility it could soar 50% to reach $0.0000205 in the coming days.
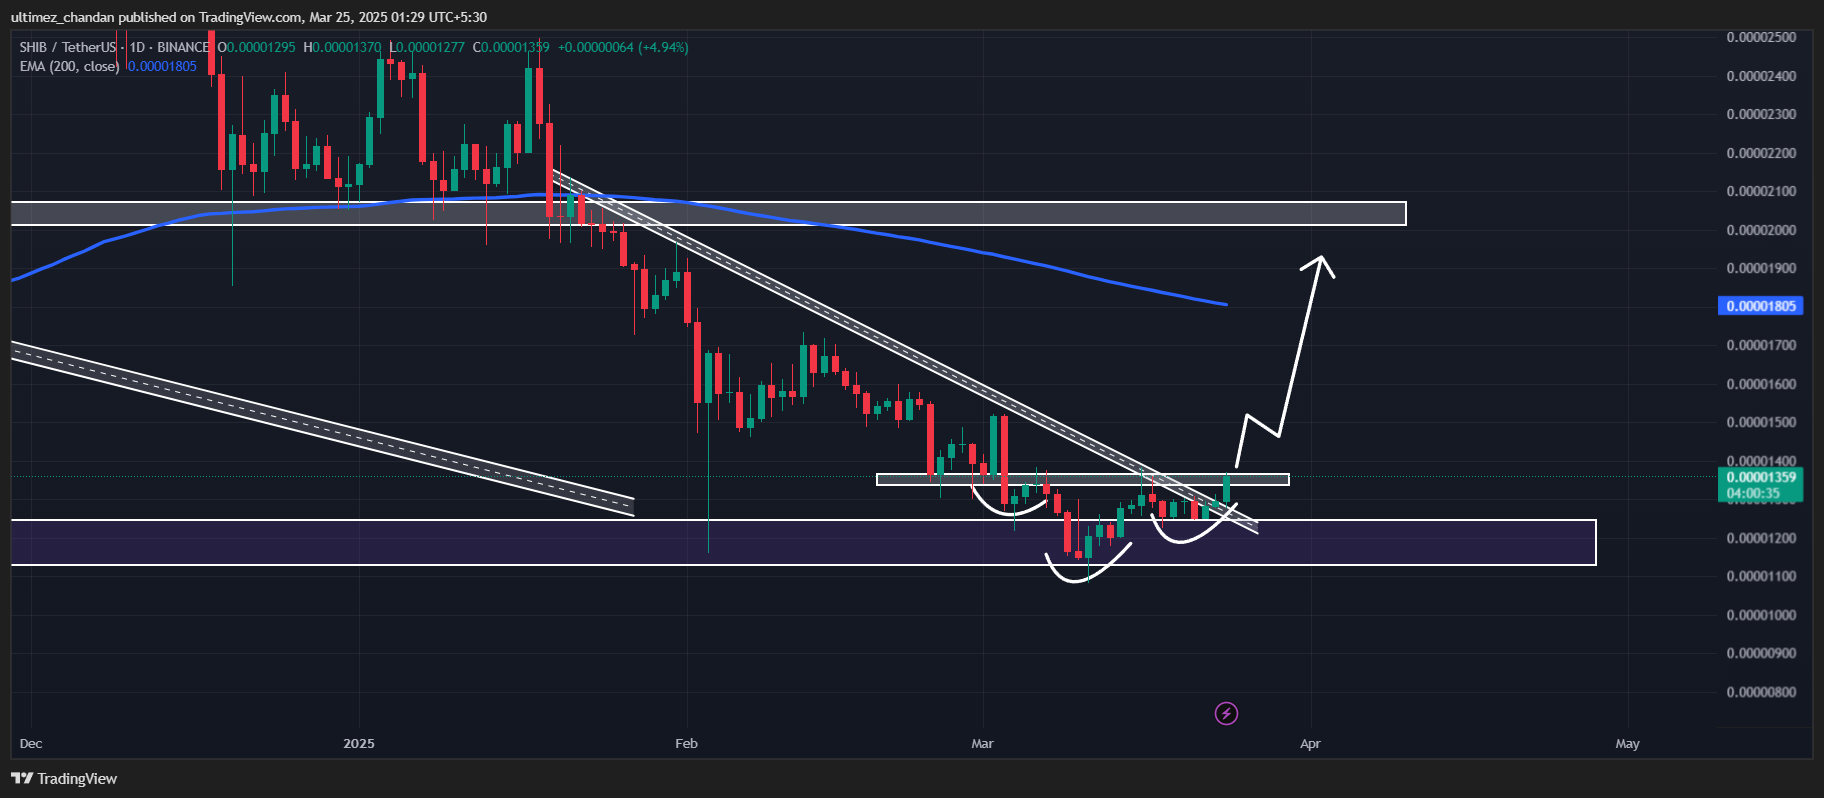
Despite an impressive price surge, SHIB has failed to reclaim the 200 Exponential Moving Average (EMA) on the daily timeframe, keeping it in a downtrend.
Current Price Momentum
At press time, SHIB is trading near $0.00001362, having surged over 7% in the past 24 hours. During the same period, the meme coin has also seen a 55% increase in trading volume, indicating heightened participation from traders and investors following the bullish price action.
Traders Over-Leveraged Levels
Following the bullish price action, intraday traders appear to be adopting the same outlook, as reported by the on-chain analytics firm Coinglass.
Data reveals that traders are currently over-leveraged at $0.0000132 on the lower side and $0.00001377 on the upper side, having built $300K and $135K worth of long and short positions, respectively, in the past 24 hours.
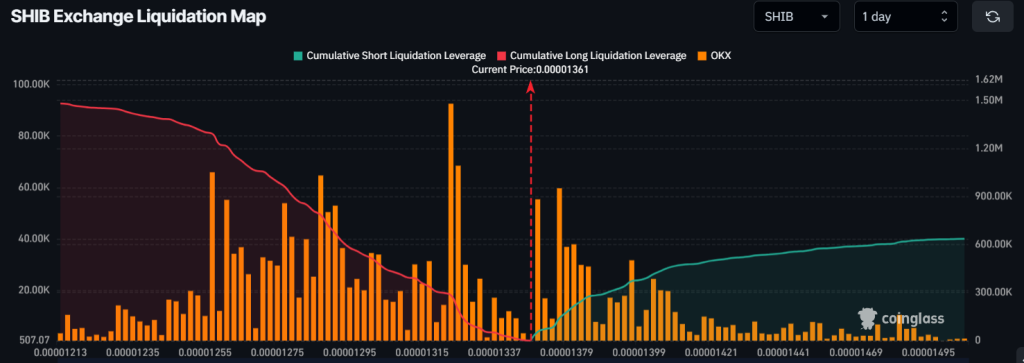
These overleveraged positions indicate that bulls are currently dominating and could push the meme coin higher in the coming days.