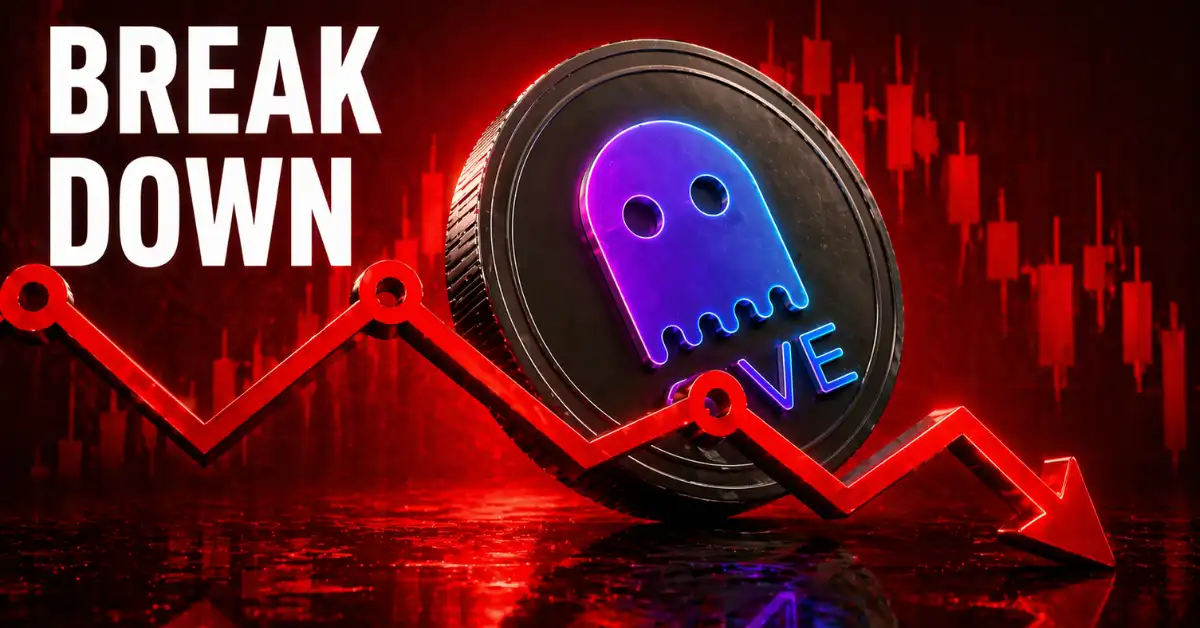
Is Aave Price About to Break Down? On-Chain Data Flashes Bearish Signs

Aave’s recovery remains weak as the price continues to face rejection near $100–$105, with momentum and capital inflows showing no strong bullish confirmation.
Rising exchange reserves alongside declining protocol activity suggest increasing sell pressure, making the current bounce fragile and vulnerable to further downside.
Aave has been under intense pressure following the recent KelpDAO exploit, which exposed vulnerabilities across the broader DeFi ecosystem. The attacker reportedly used a bridge-related flaw to mint fake collateral, borrow real ETH from Aave, and leave behind bad debt estimated at nearly $280 million. The impact was immediate—AAVE price, which was struggling to hold above $115, dropped sharply toward the $85 zone.
Now, even as price attempts a recovery above $93, the underlying signals tell a different story. Capital flows, exchange reserves, and protocol-level activity are no longer aligning with a typical recovery phase, raising concerns about the strength of this bounce.
So the question is, is Aave price simply reacting to short-term fear after the exploit, or is the data pointing to something deeper—like distribution and rising sell pressure?
On-Chain and DeFi Data Reveal Weak Recovery Structure
After the initial price shock, a closer look at both on-chain and protocol-level data reveals that Aave’s recovery may not be as strong as it appears. Exchange flows and DeFi activity are beginning to diverge from what is typically seen during a healthy rebound, raising concerns about whether this move has real strength or is simply a temporary reaction.

Exchange Inflows Spike as Sell-Side Pressure Builds
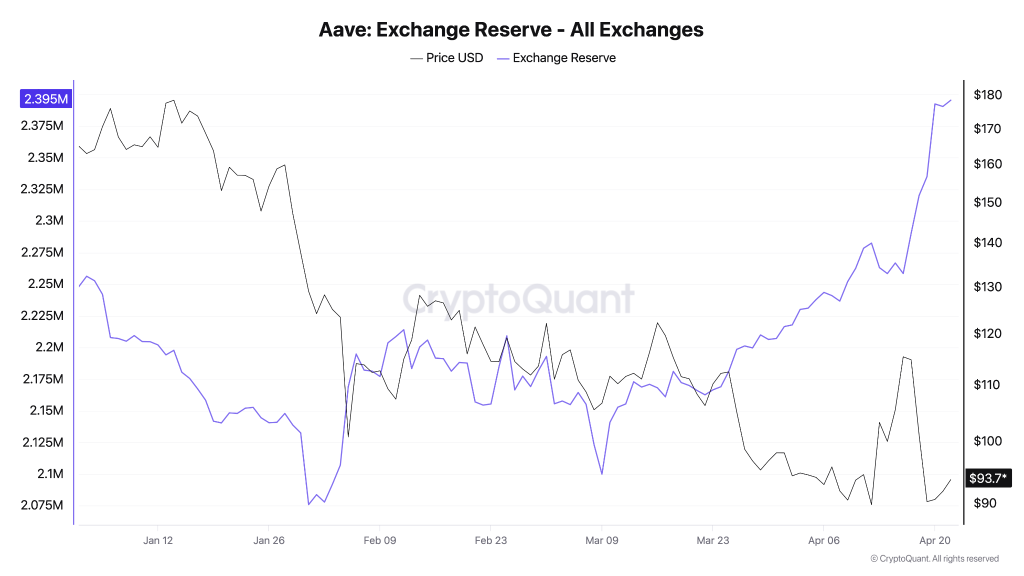
The exchange reserve chart shows a sharp spike in AAVE balances, climbing to nearly 2.39 million tokens in a short span. This kind of inflow usually indicates that holders are moving assets onto exchanges, often with the intent to sell. Historically, such spikes tend to precede increased volatility or downside moves, especially when not accompanied by strong demand.
Capital Outflows Point to Fading Demand Strength
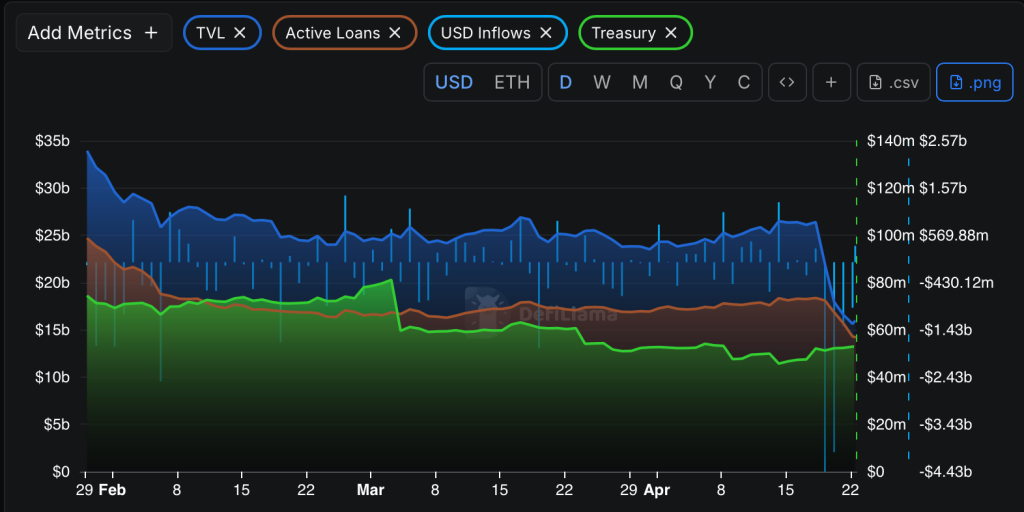
The DeFiLlama chart doesn’t just show TVL declining—it reflects a broader contraction across the protocol. Alongside TVL dropping, active loans are flattening/declining, indicating reduced borrowing demand. Treasury growth appears stagnant, suggesting limited value accrual, while USD inflows have weakened, pointing to lower fresh capital entering the ecosystem.
The combination of rising exchange reserves and falling TVL creates a clear imbalance—supply is increasing while demand is weakening. This is not a typical recovery setup. While short-term bounces can occur, the current structure leans toward distribution and cautious sentiment rather than strong accumulation. Unless exchange reserves begin to decline and protocol activity stabilizes, any upside move risks being temporary, with downside pressure still firmly in play.
Aave Price Analysis: Structure Shows Weak Recovery
Aave’s price action continues to reflect a weak and reactive structure rather than a strong reversal. After the sharp drop from above $115, the price attempted multiple recoveries but consistently faced rejection near the $100–$105 zone, which now acts as immediate resistance. The broader structure still shows lower highs and sustained selling pressure, indicating that buyers have not regained control.
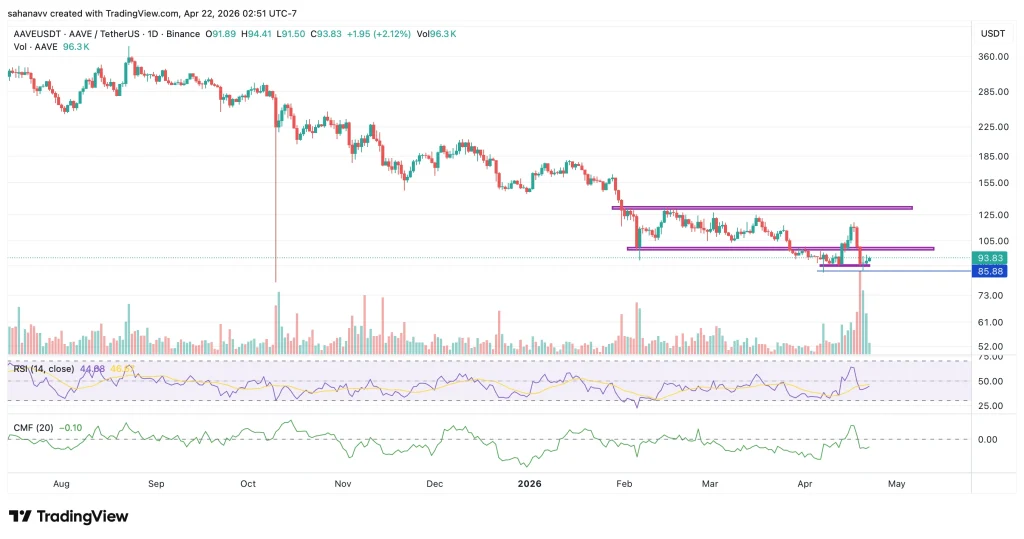
On the downside, the $85–$90 range remains a critical support zone. Price recently swept liquidity below this level before bouncing back toward $93, but the recovery lacks conviction. Momentum indicators support this view—RSI is hovering around mid-levels (~45–50), showing no strong bullish momentum, while CMF remains negative, signaling that capital inflows are still weak.
The Bottom Line
Aave’s current setup reflects a clear mismatch between price attempts and underlying strength. While short-term bounces are occurring, rising exchange reserves, declining protocol activity, and weak price structure all point toward distribution rather than accumulation.
Unless AAVE price can reclaim and hold above the $100–$105 resistance with strong volume and improving on-chain signals, the path of least resistance remains uncertain, with downside risks still in play. For now, the data suggests that this is not a confirmed recovery, but a fragile consolidation phase where any breakdown could trigger another leg lower.
Was this writing helpful?
Trust with CoinPedia:
CoinPedia has been delivering accurate and timely cryptocurrency and blockchain updates since 2017. All content is created by our expert panel of analysts and journalists, following strict Editorial Guidelines based on E-E-A-T (Experience, Expertise, Authoritativeness, Trustworthiness). Every article is fact-checked against reputable sources to ensure accuracy, transparency, and reliability. Our review policy guarantees unbiased evaluations when recommending exchanges, platforms, or tools. We strive to provide timely updates about everything crypto & blockchain, right from startups to industry majors.
Investment Disclaimer:
All opinions and insights shared represent the author's own views on current market conditions. Please do your own research before making investment decisions. Neither the writer nor the publication assumes responsibility for your financial choices.
Sponsored and Advertisements:
Sponsored content and affiliate links may appear on our site. Advertisements are marked clearly, and our editorial content remains entirely independent from our ad partners.