- Sahana Vibhute
 Sahana Vibhute
- Apr 11, 2026 12:11 UTC
-
Bitcoin Weekly MACD Turns Bullish — Why This Doesn’t Confirm a Market Bottom Yet

Bitcoin’s weekly MACD turning bullish, but past cycles show such crossovers often occur before the actual market bottom forms.
BTC must reclaim key resistance to confirm a reversal, as failure to hold support could trigger another downside move toward lower liquidity zones.
Bitcoin price has been rising in the past few days, despite the higher CPI rates, marking a local high at $73,400. With this, the price has surged above a crucial resistance zone, which may validate a rise above the bearish influence. However, the historical data show that the current trade setup does not confirm a market bottom and can appear during the ongoing downtrends.
In the previous rallies, the current trade setup resulted in a significant pullback for two consecutive times. This highlights the possibility of early momentum shifts, which often act as temporary relief signals rather than true reversals. Now the question arises whether the BTC price will repeat its previous pattern and slash hard by more than 30% or transform the current reversal into a sustained upswing.
MACD Signal vs Market Structure—Here’s What Traders Must Watch
The Bitcoin price has entered a pivotal resistance zone between $70,972 and $74,585, which hints towards a bullish reversal. However, the historical price action suggests the price has not bottomed yet. Therefore, if the pattern repeats, the BTC price may slash hard below $50,000 or may go lower too.
Bitcoin is trying to stabalise after a sharp correction, and the current MACD is turning positive with the momentum improving. But here’s a major catch.
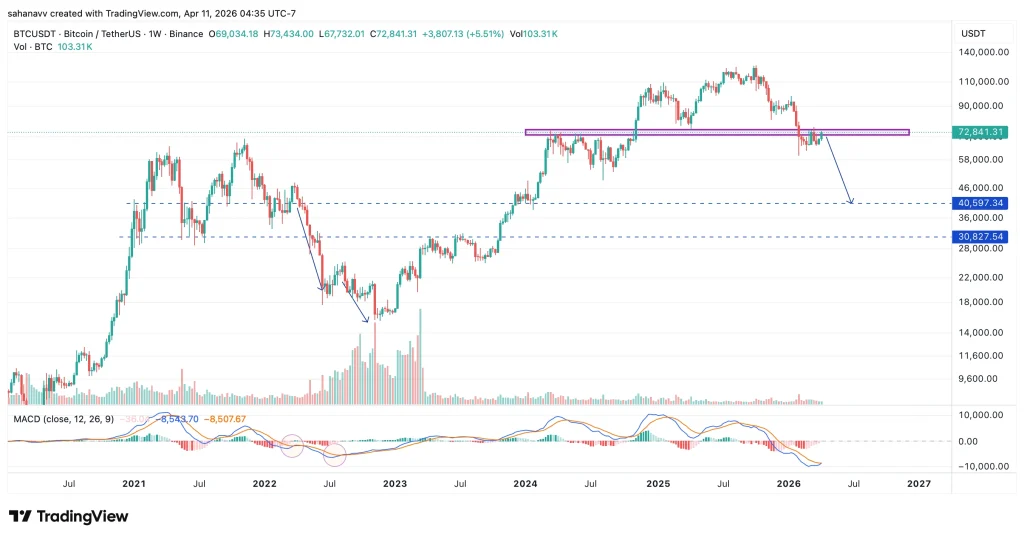
Currently, the BTC price is trading below prior major highs, lacking a clear higher high and low structure, and showing signs of consolidation rather than expansion. As seen in the above chat, the weekly MACD is showing signs of a bullish crossover in the times when Bitcoin is in a bear market. This indicator could hint towards a reversal, while previously, during the 2022 bear markets, the price experienced 2 corrections of 60% and 40%.
Therefore, if the price holds the current range and builds higher lows, it may lead to a gradual trend reversal. Or in the bearish case, if Bitcoin sees another leg down or extended consolidation, a final bottom may form after a liquidity sweep.
What’s Next for the Bitcoin (BTC) Price?
Bitcoin’s weekly MACD turning bullish signals a shift in momentum, but not a confirmed trend reversal. As history shows, these signals can appear before the actual bottom, making price action the only reliable confirmation.
Currently, the BTC price is trading in a decisive phase, where a rise beyond $85,000 could be possible if it holds the range between $75,000 and $78,000. Failure to break the resistance could trigger a breakdown below $60,000, which may extend to $50,000 as well.
However, the real signal is the Bitcoin price structure, not just the momentum.
Trust with CoinPedia:
CoinPedia has been delivering accurate and timely cryptocurrency and blockchain updates since 2017. All content is created by our expert panel of analysts and journalists, following strict Editorial Guidelines based on E-E-A-T (Experience, Expertise, Authoritativeness, Trustworthiness). Every article is fact-checked against reputable sources to ensure accuracy, transparency, and reliability. Our review policy guarantees unbiased evaluations when recommending exchanges, platforms, or tools. We strive to provide timely updates about everything crypto & blockchain, right from startups to industry majors.
Investment Disclaimer:
All opinions and insights shared represent the author's own views on current market conditions. Please do your own research before making investment decisions. Neither the writer nor the publication assumes responsibility for your financial choices.
Sponsored and Advertisements:
Sponsored content and affiliate links may appear on our site. Advertisements are marked clearly, and our editorial content remains entirely independent from our ad partners.