Sohrab Khawas

Sohrab Khawas

Author
Sohrab is a passionate cryptocurrency news writer with over five years of experience covering the industry. He keeps a keen interest in blockchain technology and its potential to revolutionize finance. Whether he's trading or writing, Sohrab always keeps his finger on the pulse of the crypto world, using his expertise to deliver informative and engaging articles that educate and inspire. When he's not analyzing the markets, Sohrab indulges in his hobbies of graphic design, minimal design or listening to his favorite hip-hop tunes.
- Oct 10, 2024 09:35 UTC
-
Bitcoin Crash: Will BTC Price Hit $52k Within a Bear Channel?

With the recent crash under $61,000, the BTC price warns of a bearish continuation in the coming weeks. The growing bearishness in the crypto market warns of a canceled Uptober rally this year.
With the crucial support of $60,000 at risk, will Bitcoin find a reversal spot before $50,000 in case of a breakdown? Will this crash in BTC price reach $50,000? Let’s find out in our Bitcoin price analysis.
Bitcoin Price Performance
Amid the failed recovery chances, the short-term rejection in BTC price near the $64k level leads to another bear cycle. The reversal phase puts additional pressure on the $60,000 support with the 2% fall yesterday.
Currently, the BTC price is trading at $60,686 with a minor intraday gain of 0.17%. The downfall creates a lower high formation and warns of an extended bear cycle within the bearish channel.
Supporting the technical analysis, Martinez Ali, in a recent X post highlighted the Bitcoin price trend trapped in a descending channel. Based on his analysis, the middle boundary at $58,000 and the lower boundary at $52,000 are critical support levels. On the upside, a bullish breakout will require the BTC price to clear the $66,000 mark.
On-Chain Reveals Critical Support at $58,943
Based on the In/out of the Money around the price, buyers with an average price between $51k and $69k, 35.58% volume is “In the Money”.
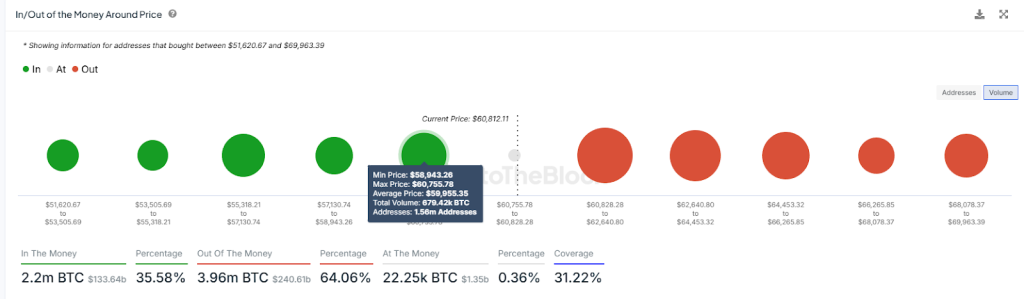
Further, the indicator highlights the next critical support zone extending from $58,943 to $60,755. Within this range, 1.56M addresses have bought 679.42k Bitcoin. Currently, the overhead resistance zone ranges from $60,828 to $62,640.
Will BTC Price Sustain Above $60k?
With the short-term surge in supply pressure, the $60k support is under pressure. However, the 200D EMA acting as a dynamic support adds strength.
Successively, a breakdown will test $58k and $55k to provide the next reversal spot. Conversely, a bullish turnaround will test the $64k and $66k resistances.
Curious about Bitcoin’s bull run in October? Check out Coinpedia’s Bitcoin (BTC) Price Prediction for an overview of long-term targets!