Sohrab Khawas

Sohrab Khawas

Author
Sohrab is a passionate cryptocurrency news writer with over five years of experience covering the industry. He keeps a keen interest in blockchain technology and its potential to revolutionize finance. Whether he's trading or writing, Sohrab always keeps his finger on the pulse of the crypto world, using his expertise to deliver informative and engaging articles that educate and inspire. When he's not analyzing the markets, Sohrab indulges in his hobbies of graphic design, minimal design or listening to his favorite hip-hop tunes.
- May 03, 2024 09:34 UTC
-
Triangle Breakout With 6% Surge In JUP Price Eyes $2

The JUP token price action shows a triangle pattern breakout.
The MACD and Signal lines tease a positive crossover.
A breakout rally in JUP price could hit the psychological milestone of $2.
As the altcoins take a bullish pivot overnight, the JUP price trend forms a morning star pattern in the 1D chart. With this uptrend revival, the Jupiter price is ready for a massive surge this week.
However, the increased volatility in the market looms as a downfall threat. Will the rising supply hit Jupiter for another drop under $1? Or, will the uptrend continue to $2? Let’s find out more in our JUP price analysis.
Jupiter Price Performance
With a 47% drop last month, the JUP price fails to cross above the psychological milestone of $2. Instead, the increased supply with the broader market correction leads to a crack below the bottom psychological support at $1.
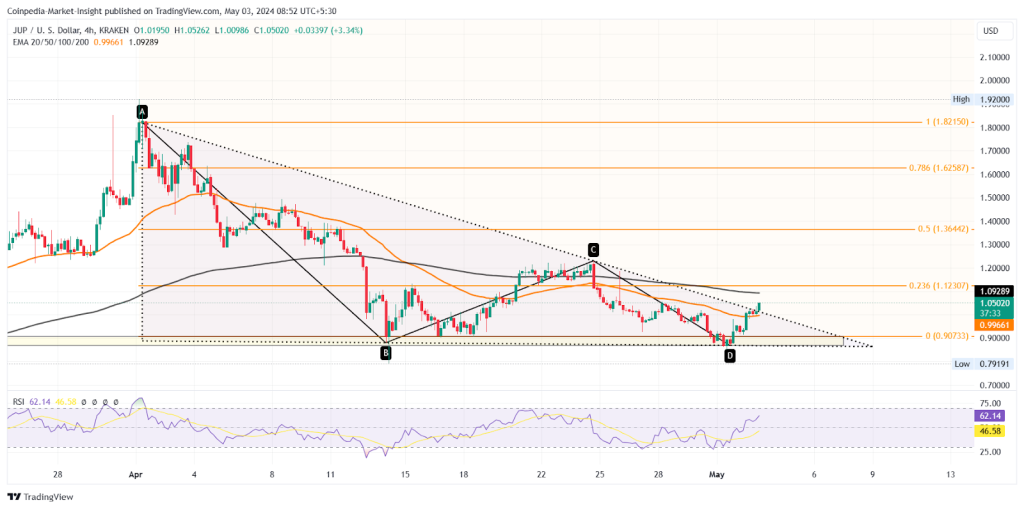
Amidst the crashing phase, Jupiter’s price action creates a descending triangle in the 4H chart with a solid resistance trendline. However, the bounce back from the $0.90 demand zone leads to a trend reversal for the Jupiter price.
With the RSI bullish divergence, the double bottom reversal leads the JUP price for the overhead trendline breakout. The reversal exceeds the 50EMA in the 4H chart and aims to reverse the bearish alignment.
Currently, the JUP price trades at $1.081 as the recovery rally reclaims the psychological mark.
Technical indicators:
EMAs: The bearish aligned 50 and 200 EMA in the 4H chart could give a golden crossover, if the uptrend sustains.
RSI: The daily RSI line shows a positive trend reaching the overbought zone which bolsters the possibility of an uptrend.
Will JUP Price Breakout Rally Hit $2?
With a breakout rally in the 4H chart and the high anticipation of a broader market bounce back, the JUP price could regain momentum. If the buyers manage to sustain the altcoin price above the 50 EMA, the breakout rally could hit $2 while facing some resistance at $1.36.
Also Check Out : Solana Gains Over 10% Amid Declining On-Chain Activity! Here’s What To Expect Next