- Yash Jain
 Yash Jain
- Reviewed by:
 Sohrab Khawas
Sohrab is a passionate cryptocurrency news writer with over five years of experience covering the industry. He keeps a keen interest in blockchain technology and its potential to revolutionize finance. Whether he's trading or writing, Sohrab always keeps his finger on the pulse of the crypto world, using his expertise to deliver informative and engaging articles that educate and inspire. When he's not analyzing the markets, Sohrab indulges in his hobbies of graphic design, minimal design or listening to his favorite hip-hop tunes.
- Feb 21, 2026 10:14 UTC
-
The Graph Price Prediction 2026, 2027 – 2030: Will GRT Price Go Up?

Story Highlights
- The live price of The Graph crypto is $ 0.02346727.
- Price predictions for 2026 range from $0.05 to $1.75.
- In 2030, GRT may hit a high of $3.55, reflecting long-term growth.
AI may be taking center stage in today’s tech revolution, but behind every smart application lies the challenge of accessing and organizing reliable data. That’s where The Graph (GRT) steps in—an innovative indexing protocol transforming how blockchain data is queried.
As interest in The Graph surges, especially after its major 2025 upgrades and the launch of substreams-powered subgraphs, the question on everyone’s mind is: Can GRT price reach $1? In this article, we break down its technical potential, rising developer adoption, and market sentiment in our detailed The Graph Price Prediction 2026–2030.
Table of contents
The Graph Price Today
| Cryptocurrency | The Graph |
| Token | GRT |
| Price | $0.0235 |
| Market Cap | $ 252,689,080.26 |
| 24h Volume | $ 16,607,035.7860 |
| Circulating Supply | 10,767,723,310.3075 |
| Total Supply | 11,503,981,643.6406 |
| All-Time High | $ 2.8751 on 12 February 2021 |
| All-Time Low | $ 0.0231 on 06 February 2026 |
Coinpedia’s GRT Price Prediction 2026
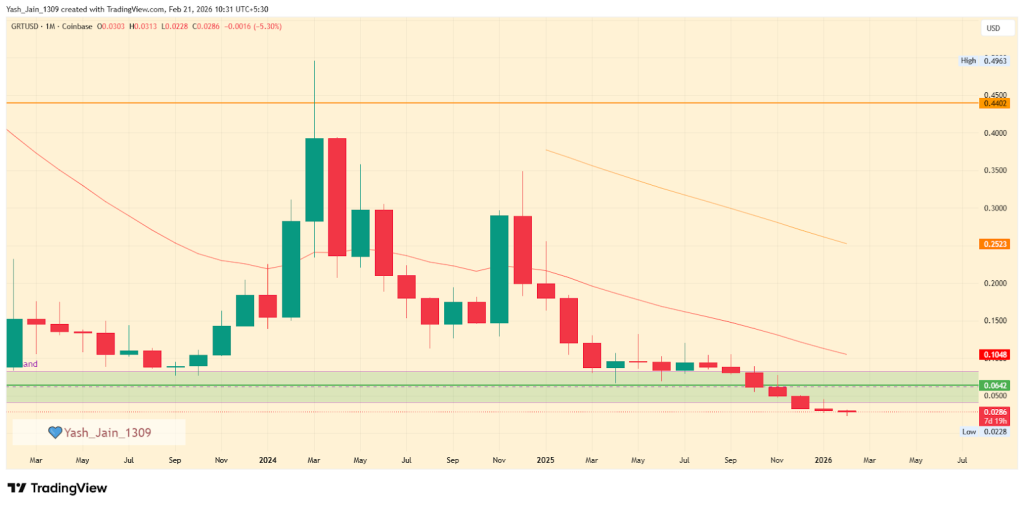
In declining price action didn’t stopped in 2026, by February the asset hit a new all-time low (ATL) of $0.0228, undermining investor confidence. If the downward trend continues, it could drop to around $0.0100. However, if it can rise above the critical level of $0.0642, it may pave the way for recovery.
Why On-Chain Hints Flourishing Network and Ecosystem Growth In “The Graph”?
The Graph Network, has recently improved its fundamental growth, yet this strength is sharply diverging from its prolonged bearish GRT price action.
The network, is majorly used by developers and data consumers who pay to query data, is flourishing, per onchain. yet, the GRT remains significantly suppressed, presenting a notable contrast that is at the heart of its current analysis.
As per the data onchain, the performance of The Graph Network can be directly assessed by the growing “volume of queries” and the “accrual of query fees”.
In this context, the data reveals that over the last six months, its query volume has impressively reached 11.6 billion, which displays a clear sign of robust developer adoption that has been particularly fast since the network’s migration to Arbitrum.
Similarly, the query fees generated by data consumers on Arbitrum have also reached an all-time high of $8.11 million in August.
This success is supported by a large community of over 167,000 delegators and 7,204 active curators, all contributing to the network’s health.
In addition, the growing ecosystem is also in the spotlight by recent integrations with major brands like Tron, pointing to a strengthening on a fundamental level.
GRT Price Prediction 2026
In 2026, many investors were surprised when prices dropped below historical lows, as assets typically exhibit bullish momentum at these pivotal levels.
However, by February, the asset had already fallen below this zone, reaching a new all-time low (ATL) of $0.0228. This decline has significantly shaken investors’ confidence. Given the current lack of improvement in price action, the worst-case scenario could see the asset drop even further, potentially reaching a new ATL around $0.0100.
On the other hand, if the asset can demonstrate positive developments within its ecosystem and rise above the previously lost level of $0.0642, because sustaining this level on a monthly chart, can reforge the way for a recovery.
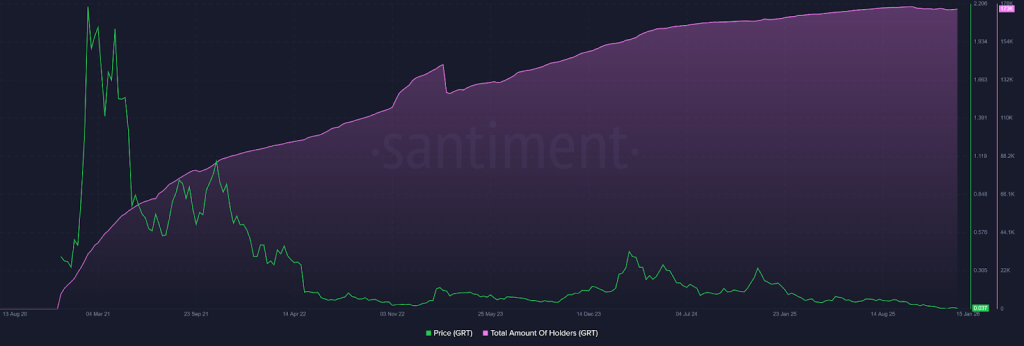
GRT On-Chain Analysis
Since the catastrophic decline from $2.15 in 2021, the total number of holders has continued to increase despite the significant price drop. This indicates that, over time, while the price has faced substantial setbacks, the community of believers in the project has been steadily growing.
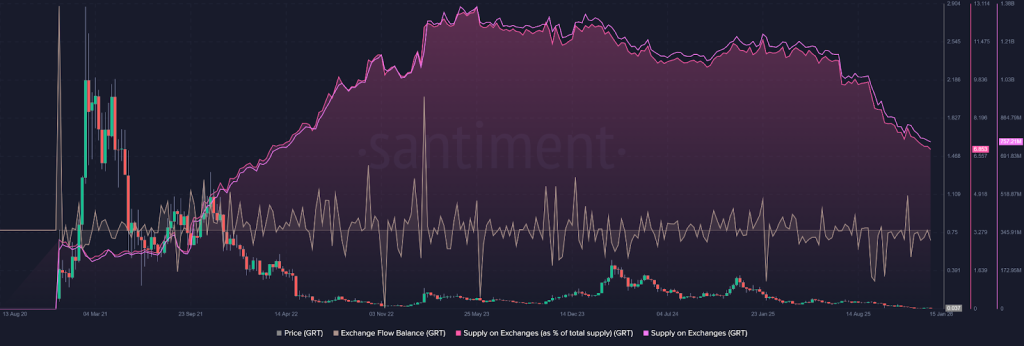
Analyzing the supply on exchanges provides insight into the 2021 downturn, which can be attributed to the FTX crash and a remarkable influx of assets onto exchanges. In late 2020, exchange supply was below 250 million; however, by May 2023, it surged to 1.36 billion. This influx of supply exerted downward pressure on GRT’s price.
In contrast, the latter half of 2023 onwards has seen a consistent decline in exchange supply. By January 2026, this figure had fallen to 757.21 million almost half of the peak supply recorded on exchanges. This trend aligns with the sustained growth in total holders of GRT, clearly indicating accumulation.
GRT Coin Price Prediction 2026-2030
| Year | Potential Low ($) | Potential Average ($) | Potential High ($) |
| 2026 | 1.05 | 1.20 | 1.75 |
| 2027 | 1.55 | 1.70 | 2.15 |
| 2028 | 2.15 | 2.20 | 2.65 |
| 2029 | 2.25 | 2.70 | 3.25 |
| 2030 | 3.15 | 3.20 | 3.55 |
The Graph Price Targets 2026
By 2026, with continued adoption and network improvements, GRT could trade between $1.05 and $1.75, with an average price of approximately $1.20.
GRT Coin Price Prediction 2027
In 2027, GRT might range between $1.55 and $2.15, averaging around $1.70 as the network potentially sees increased usage and partnerships.
The Graph Token Price Prediction 2028
For 2028, GRT could trade between $2.15 and $2.65, with an average price of approximately $2.20, assuming continued growth in the blockchain indexing sector.
GRT Crypto Price Projection 2029
By 2029, GRT might range between $2.25 and $3.25, with an average trading price of $2.70, as the project matures and potentially captures a larger market share.
The Graph Price Prediction 2030
By 2030, GRT could potentially reach a high of $3.55, with a low of $3.15 and an average price of approximately $3.20, reflecting a decade of development and adoption.
What Does The Market Say?
| Firm Name | 2026 | 2030 |
| Changelly | $0.320 | $1.89 |
| priceprediction.net | $0.493 | $2.26 |
| DigitalCoinPrice | $0.27 | $0.58 |
Never Miss a Beat in the Crypto World!
Stay ahead with breaking news, expert analysis, and real-time updates on the latest trends in Bitcoin, altcoins, DeFi, NFTs, and more.
FAQs
At the time of writing, the price of 1 The Graph Token was $ 0.02346727
GRT price in 2026 may range from $0.05 in weak demand to $1.75 in strong demand, with an average target near $1.20.
By 2030, GRT could trade between $3.15 and $3.55 if adoption continues and the protocol becomes a core data layer for Web3.
GRT has strong fundamentals, growing developer adoption, and real utility, making it a promising long-term project, though price volatility remains high.
Yes, based on network growth and adoption, some projections suggest GRT could reach between $1.05 and $1.75 by 2026, though market conditions will ultimately determine its price path.
GRT
BINANCE
Disclaimer and Risk Warning
The price predictions in this article are based on the author's personal analysis and opinions. CoinPedia does not endorse or guarantee these views. Investors should conduct independent research before making any financial decisions.