Sohrab Khawas

Sohrab Khawas

Author
Sohrab is a passionate cryptocurrency news writer with over five years of experience covering the industry. He keeps a keen interest in blockchain technology and its potential to revolutionize finance. Whether he's trading or writing, Sohrab always keeps his finger on the pulse of the crypto world, using his expertise to deliver informative and engaging articles that educate and inspire. When he's not analyzing the markets, Sohrab indulges in his hobbies of graphic design, minimal design or listening to his favorite hip-hop tunes.
- Oct 16, 2024 08:38 UTC
-
Solana Eyes $200 as Daily Active Addresses Cross 4.5M

As the Bitcoin price crosses above the $67,000 mark, the Solana price retains the $150 psychological mark. With a market cap of $72.15 billion, the SOL price is sustaining a positive trend.
Will Solana’s breakout rally above the $150 level result in an explosive Uptober rally? Find out more about our SOL price analysis below.
Solana (SOL) Price Performance
With a 7.35% surge in the last seven days, the altcoin registers a 17% hike in the last month. However, in the daily chart, the local resistance trend line sustains dominance and keeps the bullish growth under check.
Despite the massive price jump of 16.38% from the 7-day low of $135, the altcoin fails to give a breakout rally. The bullish failure led to a 1.78% drop yesterday, continued by the 0.63% intraday pullback.
As the double-bottom breakout rally reverses from the overhead trend line, the Solana price is struggling to sustain dominance above the $150 mark.
Daily Active Addresses Hit ATH
With the SOL price recovery run, the number of daily active addresses over the network registered an all-time high on October 14. The number reached 4.61M and currently stands at 4.51M.
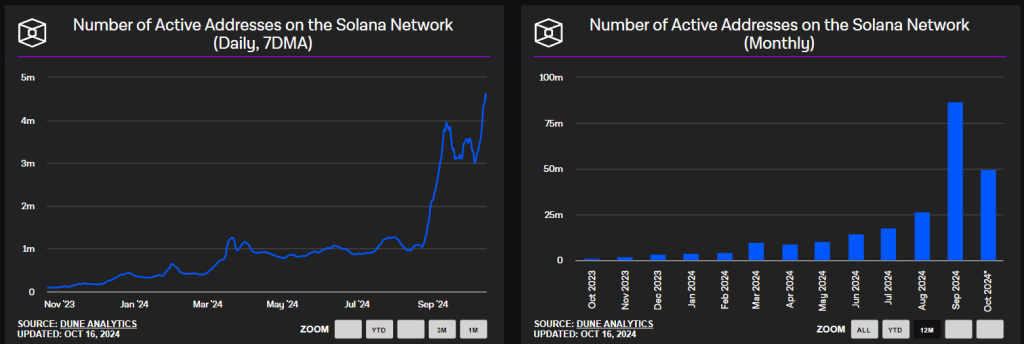
As the Solana network expands, the rising demand will fuel the SOL prices in the DeFi and broader crypto market.
Will Solana Hit $200?
Despite the short-term increase in price volatility, the Solana uptake in the 50-day EMA maintains a positive alignment with the 200-day EMA. Furthermore, the bullish crossover in the MACD and signal lines are on a positive trajectory. Hence, Solana’s technical indicators remain optimistic.
With the overhead trendline breakout amid broader market recovery, SOL price will likely challenge the $186 resistance level, followed by the $201 mark. On the flip side, a drop and extension in pullback will likely challenge the $147 support level, followed by the 200-day EMA at $141.
Curious about Solana’s future? Read our Solana (SOL) Price Prediction for an overview of long-term targets!