Qadir AK

Qadir AK

Author
Qadir Ak is the founder of Coinpedia. He has over a decade of experience writing about technology and has been covering the blockchain and cryptocurrency space since 2010. He has also interviewed a few prominent experts within the cryptocurrency space.
- Aug 09, 2023 13:14 UTC
-
MATIC Price Analysis: Here’s How This Wedge Breakout Can Boost MATIC Price By 20%!
MATIC price action shows a bullish breakout of a falling wedge pattern in the daily chart.
The Polygon coin price jumps by 4.54% in the last 24 hours.
Bouncing back from $0.65 projects a 20% potential growth in MATIC coin price.
Facing rejection at $0.85, the extensive selling pressure led MATIC coin price action into a falling wedge pattern. The downtrend dropped the Polygon market value to $0.65, accounting for a 22.60% discount.
In a bullish turn of events, the MATIC coin price bottoms out the downfall at $0.65, resulting in a 4.78% recovery.
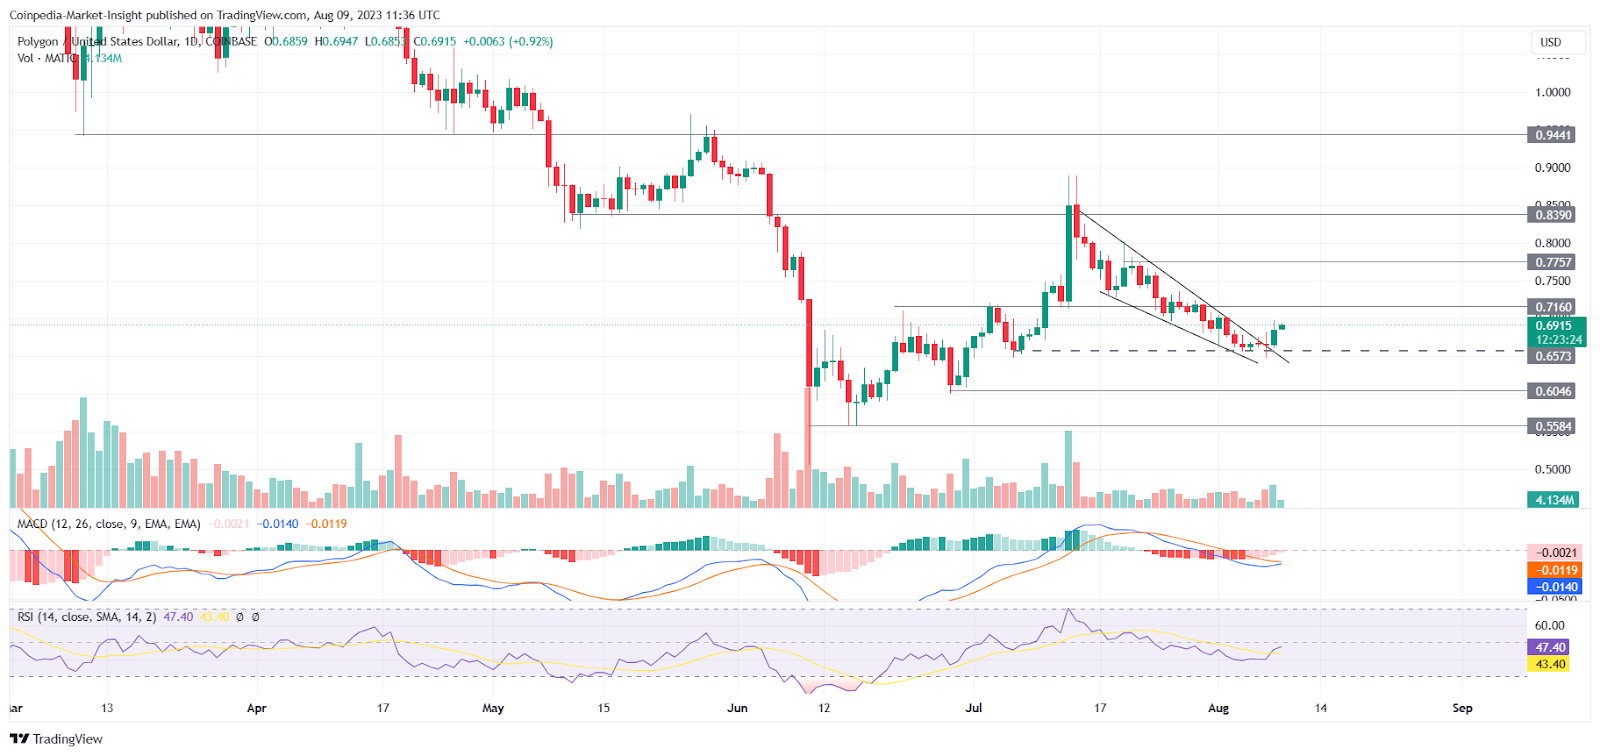
MATIC prices end the short-term correction phase with a morning star pattern leading to a bullish reversal forming at $0.65. With a spike in the intraday trading volume, the trend reversal may shortly challenge the overhead resistance at $0.7160.
Coming to the technical indicators, the MACD and RSI indicators support the ongoing recovery rally. The MACD and signal lines are ready for a bullish crossover, with the bearish histograms declining. Meanwhile, the RSI indicator shows a sharp uptick leading to a bullish reversal, reflecting a solid underlying bullish sentiment.
The unleashed trapped momentum from the falling wedge pattern is expected to fuel the breakout rally. Following a potential retest, the MATIC price can break the previous swing high of $0.85.
On the flip slide, an early reversal leading to MATIC prices below $0.65 can drop the market value by 7.39% to test $0.60.