- Sahana Vibhute
 Sahana Vibhute
- Jan 30, 2026 13:05 UTC
-
Liquidity Builds Above Bitcoin (BTC) Price—Bearish Signal or Short Squeeze Setup?
Bitcoin recorded one of its sharpest early-2026 pullbacks, triggering a broad leverage reset and shifting short-term price structure into a consolidation phase.
Liquidation heatmap data indicates concentrated leveraged positioning at key levels, suggesting traders are positioning to take profits near defined thresholds, increasing the risk of cascading liquidations if support fails to hold.
The recent rally in gold and silver has paused after strong upside momentum, coinciding with increased volatility across equities and crypto markets. Bitcoin posted its second consecutive bearish daily candle, briefly dipping toward the $81,000 level before recovering part of the losses. While short-term buying interest has emerged, the broader price structure continues to reflect downside risk. This is keeping concerns of a deeper pullback intact.
In this context, liquidation data becomes a key analytical tool. Liquidation clusters and leverage positioning help identify potential pressure zones. They also reveal whether market participants are positioning defensively or preparing for continuation moves. This data-driven view provides clearer insight into Bitcoin’s likely next price action than sentiment alone.
Liquidity Heatmap Highlights Key Pressure Zones for Bitcoin Price
Bitcoin price has entered a consolidation phase after an early-2026 pullback, with price briefly testing the $81,000 before stabilising. Despite a partial recovery, derivatives data continues to signal elevated risk around key levels. Open interest remains near $58 billion, while recent sessions saw long liquidations dominate short-side exits. With spot price trading below major liquidation clusters, short-term price action is increasingly driven by leverage positioning rather than spot demand.
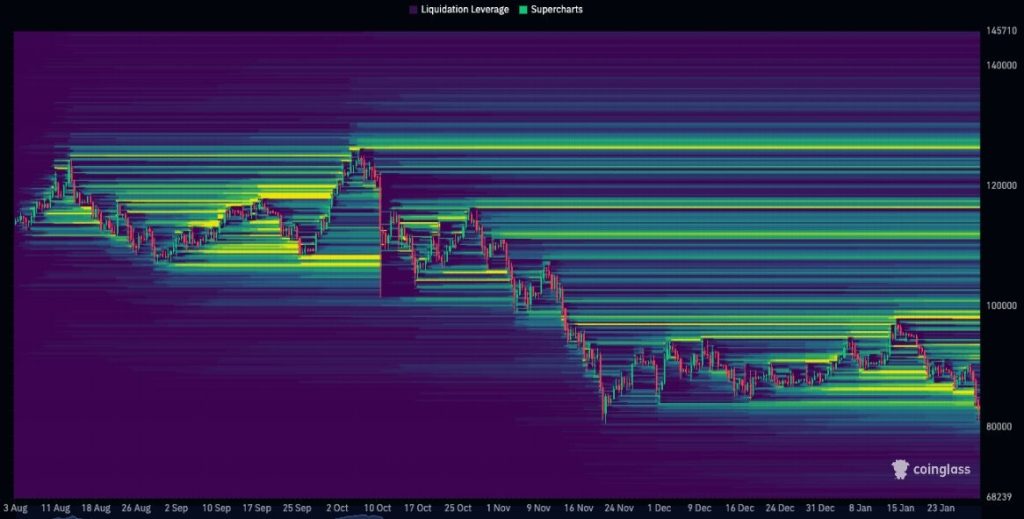
The liquidation heatmap shows a dense concentration of leveraged positions above the current Bitcoin price, with the largest cluster forming near $98,000, holding over $300 million in potential liquidations. Downside liquidity below $82,000 appears comparatively thin, indicating much of the sell-side leverage has already been cleared. This imbalance suggests volatility is skewed toward upside tests, though failure to regain momentum could keep the price range-bound until leverage rebuilds.
- Also Read :
- Market Meltdown: Gold, Silver, Stocks & Crypto Crash Altogether—What’s Next for Bitcoin Price?
- ,
$98,000 Emerges as a Critical Liquidity-Driven Zone
If Bitcoin (BTC) price advances toward the $98,000 level, liquidation heatmap data suggests a sharp increase in volatility rather than a clean breakout. The zone hosts over $300 million in leveraged positions, making it a high-probability liquidation trigger. A move into this area could force the unwinding of overleveraged positions, generating rapid buy-side orders and increasing the risk of a short squeeze. However, once this liquidity is absorbed, price behaviour will depend on sustained spot demand. As such, $98,000 should be viewed as a liquidity turning point, not a confirmed resistance or support level.
FAQs
Price is now driven more by leverage positioning than spot demand. Dense liquidation clusters above the current price create pressure zones that can accelerate moves.
Downside risk remains. While some buy interest emerged near $81,000, the overall structure is bearish until Bitcoin can decisively reclaim higher support levels.
It reveals heavy liquidation clusters near $98,000 and thinner leverage below $82,000, indicating volatility is skewed toward potential upside tests in the near term.
Trust with CoinPedia:
CoinPedia has been delivering accurate and timely cryptocurrency and blockchain updates since 2017. All content is created by our expert panel of analysts and journalists, following strict Editorial Guidelines based on E-E-A-T (Experience, Expertise, Authoritativeness, Trustworthiness). Every article is fact-checked against reputable sources to ensure accuracy, transparency, and reliability. Our review policy guarantees unbiased evaluations when recommending exchanges, platforms, or tools. We strive to provide timely updates about everything crypto & blockchain, right from startups to industry majors.
Investment Disclaimer:
All opinions and insights shared represent the author's own views on current market conditions. Please do your own research before making investment decisions. Neither the writer nor the publication assumes responsibility for your financial choices.
Sponsored and Advertisements:
Sponsored content and affiliate links may appear on our site. Advertisements are marked clearly, and our editorial content remains entirely independent from our ad partners.