- Yash Jain
 Yash Jain
- Feb 06, 2026 16:32 UTC
-
Is BTC Price Staging a Relief Rally or a Dead Cat Bounce? Can BTC Price Hold the Weekly 200-EMA Support?
BTC price chart shows Bitcoin clinging to 200-WEMA; breach could target $53K support.
Whale Ratio hits yearly high, signaling aggressive deposits and potential dumps on Binance.
On-chain shifts correlate with price weakness, urging caution more than ever.
BTC price rebounded to nearly $69,500 after briefly breaking down toward $60,000 in recent week, triggering debate over whether the move reflects stabilization or a classic dead-cat bounce. While crowd sentiment has flipped deeply bearish, on-chain data shows rising whale exchange activity, adding complexity to Bitcoin’s short-term outlook.
Crowd Psychology Turns Deeply Bearish After Sharp Selloff
When markets fall aggressively, expectations often follow price. After BTC price slipped to $60,000, social sentiment quickly shifted toward calls for “lower” and “below,” signaling widespread fear among retail participants. Historically, such spikes in bearish crowd language tend to occur closer to local inflection zones rather than continuation peaks.
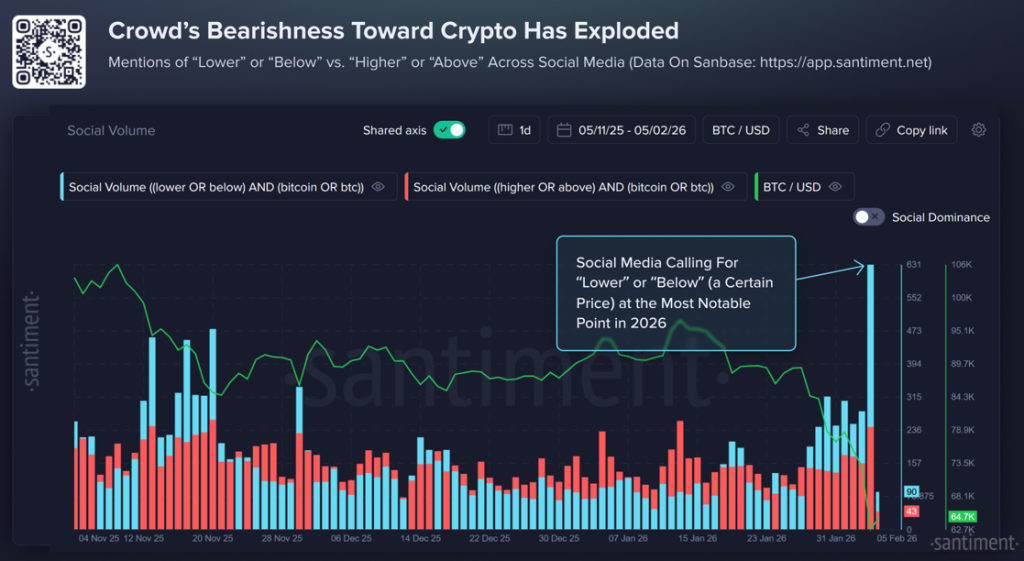
Meanwhile, data tracking social volume suggests that pessimism has intensified rather than faded during the rebound toward $69,500. This imbalance indicates that confidence in the recovery remains fragile, even as price attempts to stabilize. Still, extreme fear phases often reduce immediate selling pressure, particularly if weaker hands have already exited.
Dead Cat Bounce or Short-Term Relief Rally?
That said, the ongoing recovery raises an very important question on the BTC price chart: is this merely mechanical short covering, or a response to sentiment exhaustion? Since, markets rarely move in straight lines, and violent declines are often followed by reflexive rebounds.
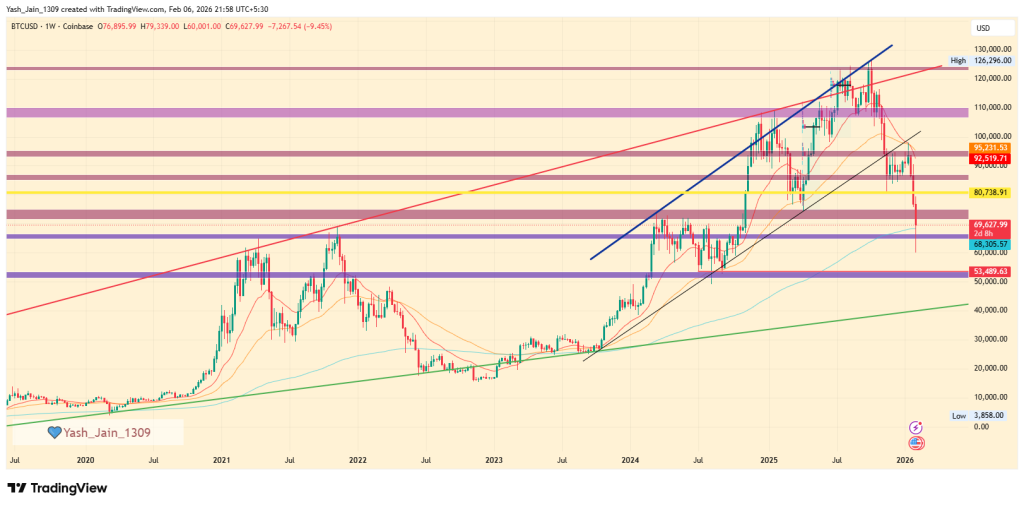
From a technical perspective, BTC price USD is hovering just above the weekly 200-EMA band, an area closely watched by long-term participants. A sustained hold above this region could allow price to revisit higher liquidity zones crossing the $70,000 area towards $80K-$85K. However, failure to defend this band would increase downside exposure toward the mid-$50,000s.
Whale Exchange Activity Adds Caution to the Setup
At the same time, on-chain behavior introduces a more defensive note. The Exchange Whale Ratio on Binance, smoothed over 30 days, has climbed to 0.447, its highest reading since March 2025. This suggests that large holders now account for a disproportionate share of exchange inflows.
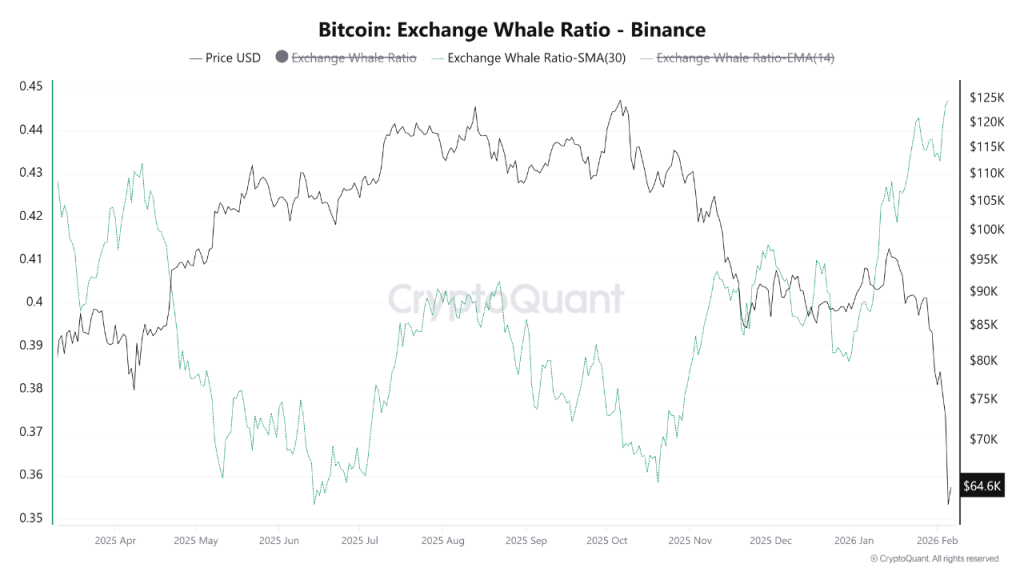
Historically, elevated whale ratios coincide with phases of distribution or hedging rather than accumulation. As shown on the chart, this spike aligns closely with Bitcoin’s recent price decline, reinforcing the idea that larger players remain active on the sell side. Until this metric begins to cool, downside risk remains structurally present.
Contradictory Signals Keep BTC Price Range-Bound
Still, the divergence between retail fear and whale pressure creates a complex environment. While extreme pessimism among smaller participants can support short-term rebounds, continued whale dominance in exchange inflows limits upside follow-through.
From a broader lens, BTC crypto markets appear to be undergoing a reset rather than a directional trend. If price stabilizes above key moving averages, the BTC price prediction narrative could temporarily shift toward consolidation or relief rallies. Conversely, renewed weakness below support could open the path toward the $53,000 region, where prior demand has historically emerged.
In this context, BTC price remains caught between sentiment exhaustion and structural selling, making the coming weeks particularly sensitive to crowd behavior and on-chain flow shifts.
Trust with CoinPedia:
CoinPedia has been delivering accurate and timely cryptocurrency and blockchain updates since 2017. All content is created by our expert panel of analysts and journalists, following strict Editorial Guidelines based on E-E-A-T (Experience, Expertise, Authoritativeness, Trustworthiness). Every article is fact-checked against reputable sources to ensure accuracy, transparency, and reliability. Our review policy guarantees unbiased evaluations when recommending exchanges, platforms, or tools. We strive to provide timely updates about everything crypto & blockchain, right from startups to industry majors.
Investment Disclaimer:
All opinions and insights shared represent the author's own views on current market conditions. Please do your own research before making investment decisions. Neither the writer nor the publication assumes responsibility for your financial choices.
Sponsored and Advertisements:
Sponsored content and affiliate links may appear on our site. Advertisements are marked clearly, and our editorial content remains entirely independent from our ad partners.