
 Advertise



Is Bitcoin Going to Crash Toward $60K? Here’s What Investors Should Watch


Bitcoin has fallen below $68,000, extending its decline to more than 20% from its October highs.
US spot Bitcoin ETFs recorded $1.91 billion in net outflows over seven consecutive trading sessions.
Nearly $1.5 billion in leveraged crypto positions were liquidated in 24 hours, increasing the risk of further downside.
Bitcoin price has plunged toward $65,000, raising fresh concerns about whether BTC could crash toward $60,000. The latest sell-off has pushed Bitcoin below $68,000, while ETF outflows and heavy liquidations continue to weaken market demand. With BTC approaching a critical support zone after several consecutive weekly losses, investors are watching for signs of a reversal. Is Bitcoin heading toward $60K, or can buyers stop the decline?
Bitcoin Loses $68K as Selling Pressure Accelerates
Bitcoin’s breakdown below $68,000 has shifted the market’s attention toward lower support levels. The cryptocurrency dropped below $66,000 on November 14, reaching its weakest level since August as selling pressure continued through the weekend.
The decline has also extended Bitcoin’s losing streak, putting it on course for a sixth consecutive weekly loss. From its October highs near $86,000, BTC has now surrendered a substantial portion of its gains.
Macroeconomic concerns are adding to the pressure. Hotter US inflation has strengthened expectations of further Federal Reserve rate increases, while a stronger dollar and rising Treasury yields have reduced appetite for riskier assets. That combination leaves Bitcoin vulnerable as investors reassess their exposure to speculative investments.

Bitcoin ETF Outflows Reach $1.91 Billion in Seven Sessions
Institutional demand is becoming another major concern for Bitcoin investors. US spot Bitcoin ETFs recorded approximately $185.45 million in net outflows on November 13, extending their withdrawal streak to seven consecutive trading sessions.
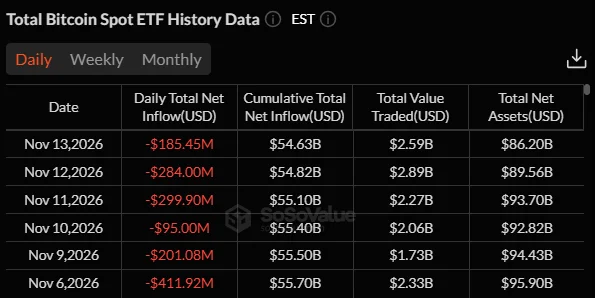
The cumulative outflows reached roughly $1.91 billion between November 5 and November 13. BlackRock’s IBIT accounted for a significant portion of the withdrawals, highlighting the scale of institutional selling pressure.
However, the broader ETF picture is not entirely negative. Despite the recent withdrawals, cumulative net inflows across US spot Bitcoin ETFs remained above $54 billion, with total net assets around $86.2 billion.
The immediate concern is whether persistent redemptions will continue to weaken demand. If ETF withdrawals extend into another week, Bitcoin could struggle to attract enough buying interest to establish a durable recovery.
$1.5 Billion in Liquidations Adds Pressure to Bitcoin
Bitcoin’s decline has also triggered a major wave of forced selling across the derivatives market. Approximately $1.5 billion in leveraged crypto positions were liquidated over 24 hours, with bullish positions accounting for the overwhelming majority.
Bitcoin positions represented a substantial share of those liquidations. When leveraged long positions are forcibly closed, exchanges sell the underlying exposure, potentially accelerating an existing decline.
This creates additional pressure during periods of weak liquidity. Traders who expected Bitcoin to recover are being forced out of positions, while fresh buyers remain cautious about entering before the market stabilizes.
Bitcoin Price Analysis: Can BTC Hold the $65K Support?
Bitcoin price is approaching a critical technical zone after losing the $70,000 and $68,000 levels. The price action shows a sustained downward trend, with lower highs and lower lows indicating that sellers remain in control.
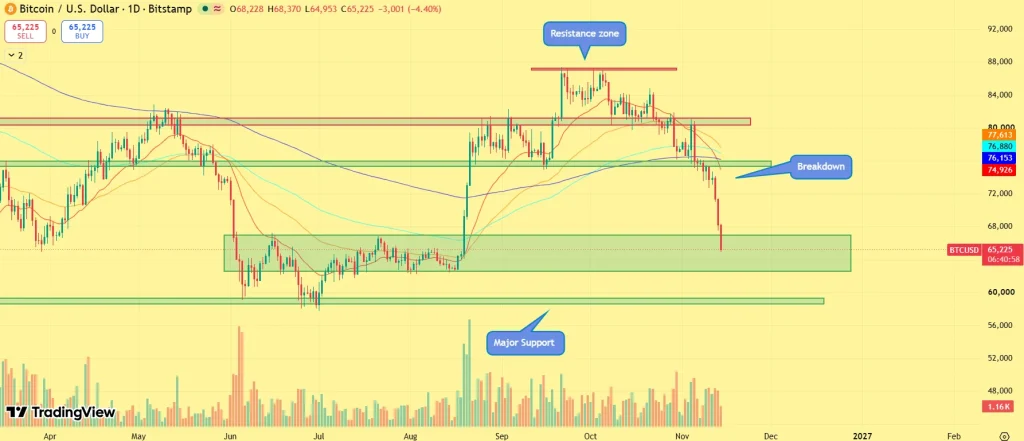
The $64,000–$68,000 region is now an important demand zone. If buyers defend this area and push BTC back above $68,000–$70,000, the cryptocurrency could attempt a short-term recovery. However, a sustained breakdown below $64,000 would expose the next major support near $60,000–$61,000. That level could become the market’s next significant test if selling pressure continues.
On the upside, Bitcoin needs to reclaim $70,000 before a stronger recovery can take shape. The $75,000–$77,000 region remains a broader resistance zone that buyers would need to overcome to improve the technical outlook.
Was this writing helpful?

Trust with CoinPedia:
CoinPedia has been delivering accurate and timely cryptocurrency and blockchain updates since 2017. All content is created by our expert panel of analysts and journalists, following strict Editorial Guidelines based on E-E-A-T (Experience, Expertise, Authoritativeness, Trustworthiness). Every article is fact-checked against reputable sources to ensure accuracy, transparency, and reliability. Our review policy guarantees unbiased evaluations when recommending exchanges, platforms, or tools. We strive to provide timely updates about everything crypto & blockchain, right from startups to industry majors.
Investment Disclaimer:
All opinions and insights shared represent the author's own views on current market conditions. Please do your own research before making investment decisions. Neither the writer nor the publication assumes responsibility for your financial choices.
Sponsored and Advertisements:
Sponsored content and affiliate links may appear on our site. Advertisements are marked clearly, and our editorial content remains entirely independent from our ad partners.