- Shrishesh Tanksalkar
 Shrishesh Tanksalkar
- Sep 22, 2025 11:32 UTC
-
Ethereum Price Slips Below $4,200 – Can Bulls Defend $4,000?

Ethereum price dips 6.8% in a day, testing key support at $4,173
Liquidations top $452M as ETH breaches major technical levels
Fear & Greed Index slides, raising caution for near-term recovery
Ethereum has come under heavy selling pressure, slipping below $4,200 after a sharp daily decline of nearly 7%. The move wiped out more than $44 billion in market value in less than a week and left traders questioning whether bulls can hold the $4,000 psychological zone. With ETH now down over 15% from its all-time high of $4,953 set just a month ago, the market faces both technical and macro headwinds.
Ethereum Price Analysis
Ethereum currently retails across exchanges at $4,173, marking a 6.89% drop in 24 hours and an 8.13% weekly decline. The sharp pullback coincides with a surge in trading volume, which jumped 122% to $41.86 billion. Market cap now stands at $500.67 billion.
Technically, ETH broke below several critical supports, one at the 30-day SMA, which is $4,465, the 78.6% Fibonacci retracement at $4,378, and the $4,394 horizontal support seen on the charts. Momentum indicators confirm the bearish tilt, with the RSI at 18.7, signaling extreme oversold conditions. Successively, the MACD histogram at -13.94 shows acceleration in downside momentum.
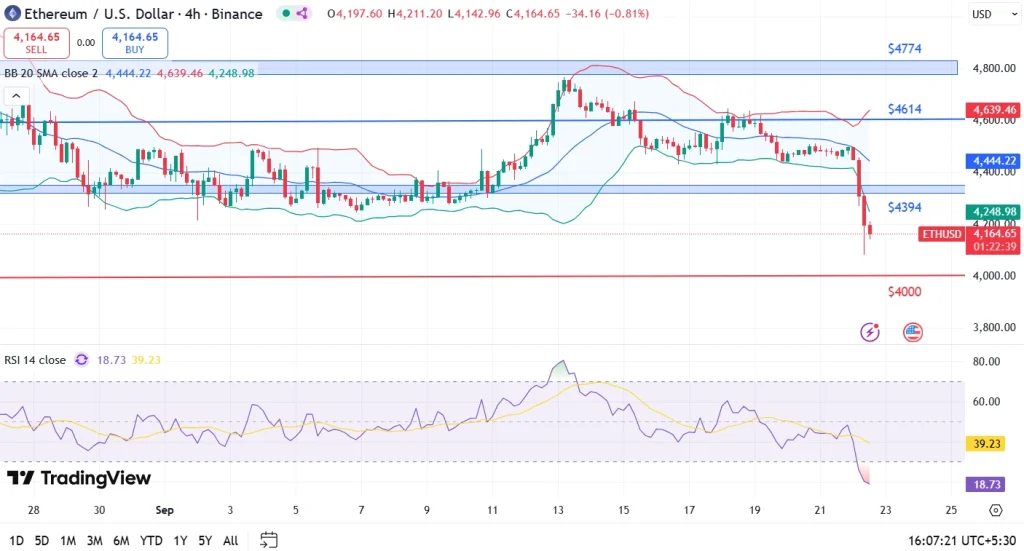
This steep fall was likely triggered by cascading liquidations. Successively, $452M in total liquidations were seen in the last 24 hours. This is with 72% being long positions, suggesting traders’ stop-losses were triggered once ETH fell under $4,400. The $4,221–$4,000 zone, which aligns with June’s swing low, now stands as the critical support area. If broken, downside could extend toward the distant 200-day EMA at $3,393.
Sentiment and Security Risks
From a sentiment perspective, the Fear & Greed Index fell to 47, signaling a shift from mild optimism to a more cautious stance compared to 51 just last week. Ethereum’s higher turnover ratio of 8.71%, versus Bitcoin’s 5.2%, shows that traders are offloading higher-beta assets like ETH. This is amid uncertainty around Federal Reserve policy moves and ongoing turmoil in Chinese markets. With $1.01 trillion in derivatives open interest, conditions were primed for cascading stop-loss triggers, amplifying the recent selloff.
On the security front, reports of phishing campaigns tied to EIP-7702 wallets resurfaced this week. $150,000 was siphoned off through malicious contract approvals. While this is not a direct protocol flaw, it raises adoption concerns. Industry responses will be key, with MetaMask already planning to roll out a “transaction simulation” feature in Q4 2025 to help users avoid such exploits.
FAQs
ETH is falling due to cascading liquidations, weaker sentiment, and macro concerns like Fed policy and China’s market risks.
Immediate support lies at $4,000. Resistance zones are $4,394 and $4,465.
Yes, despite short-term volatility, ETH remains well above its 200-day EMA at $3,393, keeping its long-term trend intact.
Trust with CoinPedia:
CoinPedia has been delivering accurate and timely cryptocurrency and blockchain updates since 2017. All content is created by our expert panel of analysts and journalists, following strict Editorial Guidelines based on E-E-A-T (Experience, Expertise, Authoritativeness, Trustworthiness). Every article is fact-checked against reputable sources to ensure accuracy, transparency, and reliability. Our review policy guarantees unbiased evaluations when recommending exchanges, platforms, or tools. We strive to provide timely updates about everything crypto & blockchain, right from startups to industry majors.
Investment Disclaimer:
All opinions and insights shared represent the author's own views on current market conditions. Please do your own research before making investment decisions. Neither the writer nor the publication assumes responsibility for your financial choices.
Sponsored and Advertisements:
Sponsored content and affiliate links may appear on our site. Advertisements are marked clearly, and our editorial content remains entirely independent from our ad partners.