- Sahana Vibhute
 Sahana Vibhute
- Dec 09, 2025 08:42 UTC
-
Ethereum Price Gears Up for a Breakout—Can ETH Outperform BTC Into the Year-End?

Regardless of the market volatility, the Ethereum price displays massive strength, aiming for a breakout from the consolidation
The technicals and the chart patterns suggest ETH price is primed to maintain a strong upswing and reach the threshold at $3500
Ethereum is compressing just below a critical resistance band near $3,300–$3,350, even as the broader crypto market remains unsettled by Bitcoin’s choppy price action around $43,000–$44,000. Despite the volatility, the ETH price has defended support near $3,050, forming a tight consolidation range that often precedes larger moves.
With the ETH/BTC pair hovering near its own inflection zone, traders are now asking: is this sustained strength a sign of accumulation—or simply a pause before another rejection? And if a breakout does occur, does $3,500 become the next logical target before the yearly close?
Two Scenarios Traders Are Watching
Bullish Scenario: Breakout Above $3,350 Opens the Door to $3,500
A decisive daily close above the $3,300–$3,350 resistance zone, backed by rising volume, would confirm a breakout from Ethereum’s ongoing consolidation. In this scenario, momentum indicators would likely expand, positioning $3,450–$3,500 as the next liquidity target ahead of the yearly close.
Potential micro-catalysts supporting upside:
- ETH/BTC breaking above near-term resistance, signalling rotation from Bitcoin into large-cap alts
- Bitcoin holding above $43,000 without aggressive selling pressure
- Renewed inflows into ETH-related derivatives, pointing to directional positioning rather than hedging
If these align, Ethereum could shift from a range-bound trade into a short-term trend, increasing the odds of temporary outperformance against Bitcoin.
Bearish or Sluggish Scenario: Rejection Near Resistance Keeps ETH Range-Bound
Failure to reclaim $3,350 — especially if followed by long upper wicks or declining volume—would indicate persistent sell pressure. In this case, Ethereum risks slipping back toward $3,100–$3,050, reinforcing the broader range rather than triggering a breakdown.
Catalysts that could stall or weaken momentum:
- ETH/BTC failing to clear resistance, keeping Bitcoin as the market’s primary capital sink
- Bitcoin rejection near $44,000, dragging risk sentiment lower
- Declining spot volume, suggesting a lack of conviction from buyers
Under this scenario, ETH may continue consolidating into the year-end, offering limited directional opportunities while traders await a clearer macro or liquidity-driven trigger.
- Also Read :
- Bitcoin Price Stalls Below $94K as ETF Inflows Cool Ahead of Key FOMC Decision—What’s Next?
- ,
What’s Next: How Will ETH Price Trade by the End of 2025?
Ethereum price is once again at a critical juncture, consolidating near $3,120 as volatility compresses across higher time frames. Despite repeated rejections from the $4,300–$4,600 supply zone, ETH continues to print higher lows, forming an ascending triangle structure. With price currently pinned between the 50-day moving average near $3,300 and the 200-day average around $2,600, traders are watching closely. A decisive break on either side could define Ethereum’s next major narrative ahead of the yearly close.
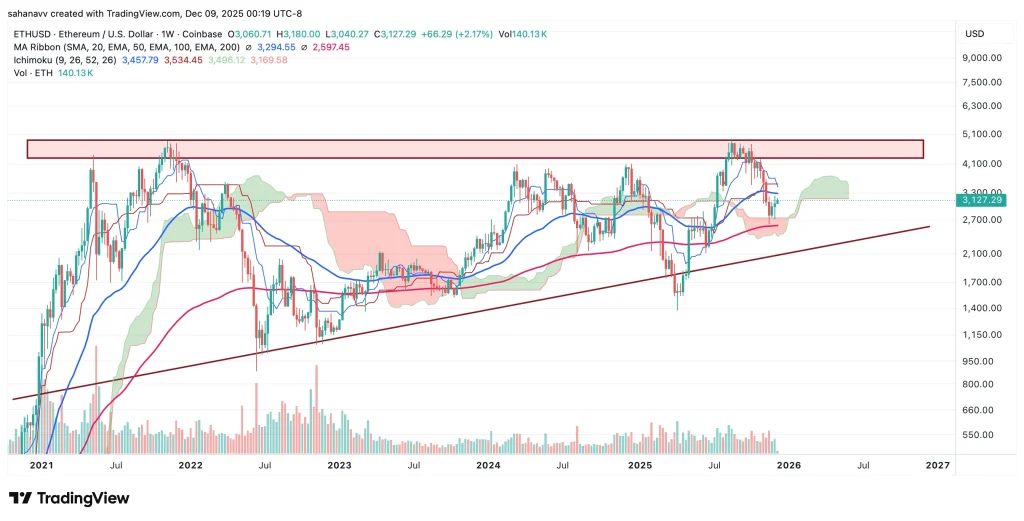
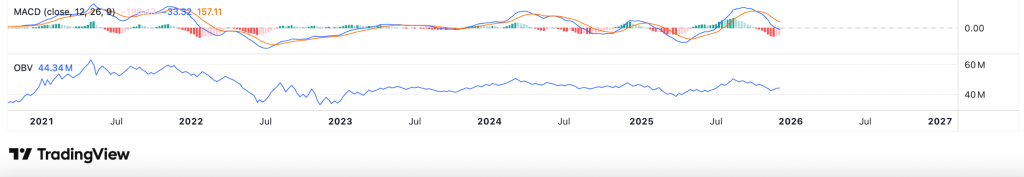
Ethereum’s weekly structure remains constructive as price coils within an ascending triangle, supported by higher lows. ETH is currently trapped between the 50-day MA near $3,300 acting as resistance and the 200-day MA around $2,600 serving as strong support, keeping volatility compressed. The Ichimoku Cloud is beginning to flatten and thin, a setup that often precedes directional expansion. Notably, OBV has printed a bullish divergence, signalling steady accumulation, while the MACD histogram shows a clear reduction in selling pressure. A confirmed break above $3,300 could open the path toward $3,500 and $4,100, while a loss of $2,600 risks a pullback toward $2,300–$2,400.
FAQs
Yes. ETH can rally in USD terms if demand rises, even without breaking the ETH/BTC range, especially during alt-rotation phases.
Rising OBV, shrinking selling volume, and steady higher lows often hint at accumulation rather than simple sideways movement.
Indirectly. High staking reduces circulating supply, which can tighten ranges and support stronger breakouts when demand returns.
A breakout backed by rising volume, stronger ETH/BTC flow, and consistent spot demand usually supports a more durable move.
Trust with CoinPedia:
CoinPedia has been delivering accurate and timely cryptocurrency and blockchain updates since 2017. All content is created by our expert panel of analysts and journalists, following strict Editorial Guidelines based on E-E-A-T (Experience, Expertise, Authoritativeness, Trustworthiness). Every article is fact-checked against reputable sources to ensure accuracy, transparency, and reliability. Our review policy guarantees unbiased evaluations when recommending exchanges, platforms, or tools. We strive to provide timely updates about everything crypto & blockchain, right from startups to industry majors.
Investment Disclaimer:
All opinions and insights shared represent the author's own views on current market conditions. Please do your own research before making investment decisions. Neither the writer nor the publication assumes responsibility for your financial choices.
Sponsored and Advertisements:
Sponsored content and affiliate links may appear on our site. Advertisements are marked clearly, and our editorial content remains entirely independent from our ad partners.