- Sahana Vibhute
 Sahana Vibhute
- Oct 17, 2025 11:28 UTC
-
Bitcoin Price Loses Key Support: Is This the Beginning of the Next Major Bear Market?

The BTC price has dropped below $105,000, and an extended bearish action could put the support at $100K at risk
After reaching a new ATH, the Bitcoin price has been plunging constantly, forming consecutive lower highs and lows
Ever since the Bitcoin price rejected from the resistance above $116,000, the bears seem to have taken control of the market. The crypto market initiated a correction, and after losing $110,000, the pullback has intensified following a drop below $105,000. Traders are closely watching on-chain flows, derivatives positioning, and macro indicators for signs of further weakness. As Bitcoin struggles to regain momentum, analysts warn that a deeper correction could be underway—potentially marking the official start of the next bearish cycle.
Is BTC Price Heading to $100K?
Major cryptos are showing weakness, and the sentiments have entered extreme fear. This week, BTC saw over $850 million in ETF outflows, at a time when Gold is setting a new record at $4,380. Gold has surged over 65% YTD while the BTC price surged just 13% YTD, hinting that no one’s got FOMO for BTC anymore. Bitcoin has never closed October in the red, and hence, 2025 seems to be quite different. Does this suggest Bitcoin price is prone to a deeper correction?
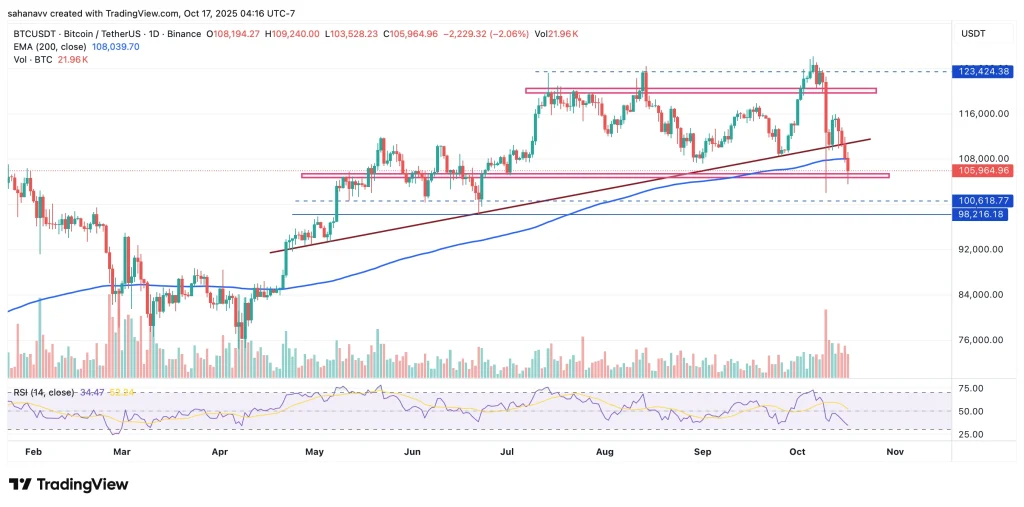
Bitcoin has decisively broken below its 200-day EMA at $108,039, signalling a potential shift from bullish to bearish territory. The drop below this long-term moving average, coupled with weakening momentum on the RSI, suggests that bears are gaining control over the market structure.
Chart Structure & Patterns
- Ascending Trendline Broken: The long-term ascending support (marked in brown) has been breached, confirming a breakdown of the uptrend that began in March 2025.
- Horizontal Support Zone: BTC is currently testing a crucial horizontal support between $105,000 and $106,000. A daily close below this range could accelerate selling pressure.
- Previous Resistance Zone: The zone around $116,000–$118,000 acted as a strong rejection area, forming a double-top pattern, which now acts as a bearish reversal confirmation.
Indicators
- RSI (14): Currently near 34, showing clear bearish momentum and hinting that BTC is approaching the oversold zone but not yet reversing.
- 200-day EMA: Now acting as a dynamic resistance, confirming a structural shift toward a bearish phase if BTC fails to reclaim it soon.
- Volume: Rising volume on red candles indicates strong distribution rather than panic selling, implying controlled bearish dominance.
Key Levels to Watch
| Zone | Type | Implication |
| $108,000–$109,000 | 200-day EMA / Resistance | Reclaim is needed to avoid deeper correction |
| $105,000–$106,000 | Immediate Support | Current zone being tested; weak hold may lead to a breakdown. |
| $100,600–$98,200 | Major Support Zone | Next critical support cluster; likely target for short-term bears |
| $123,400 | Local Resistance | Must break for trend reversal confirmation |
Price Targets
- Bearish Target 1: $102,000 – testing the early May breakout zone.
- Bearish Target 2: $98,000 – aligns with the previous accumulation range and volume support.
- Bullish Recovery Target: If BTC bounces back above $108,000 and closes above $110,000, it could attempt a retest of $116,000, invalidating the immediate bearish bias.
Bitcoin price is at a make-or-break stage, sitting just above a critical support cluster. The loss of the 200-day EMA and a breakdown from the ascending trendline point toward a shift to a medium-term bearish trend, unless the bulls reclaim $108,000 in the coming sessions.
If the current support fails, the BTC price could retrace toward $100,000–$98,000 before stabilising.
FAQs
The drop is driven by over $850 million in ETF outflows, a break below the critical 200-day moving average, and a shift in market sentiment to “extreme fear.”
While not confirmed, several bearish signals are present, including a broken uptrend and a double-top pattern. A sustained break below $105,000 would increase the odds of a deeper correction.
As per Coinpedia’s BTC price prediction, the Bitcoin price could peak at $168k this year if the bullish sentiment sustains.
Trust with CoinPedia:
CoinPedia has been delivering accurate and timely cryptocurrency and blockchain updates since 2017. All content is created by our expert panel of analysts and journalists, following strict Editorial Guidelines based on E-E-A-T (Experience, Expertise, Authoritativeness, Trustworthiness). Every article is fact-checked against reputable sources to ensure accuracy, transparency, and reliability. Our review policy guarantees unbiased evaluations when recommending exchanges, platforms, or tools. We strive to provide timely updates about everything crypto & blockchain, right from startups to industry majors.
Investment Disclaimer:
All opinions and insights shared represent the author's own views on current market conditions. Please do your own research before making investment decisions. Neither the writer nor the publication assumes responsibility for your financial choices.
Sponsored and Advertisements:
Sponsored content and affiliate links may appear on our site. Advertisements are marked clearly, and our editorial content remains entirely independent from our ad partners.