- Sahana Vibhute
 Sahana Vibhute
- May 30, 2025 18:02 UTC
-
Bitcoin Price Displays a Similar Deviation: Is it Time for a Deeper Correction?
Bitcoin price is experiencing a significant upward pressure as the price slides below the crucial resistance-turned-support zone
The token is displaying a similar deviation while the trend has reversed, which raises concerns over the upcoming price action
Ever since the start of the week, the Bitcoin price has been facing significant bearish pressure as the selling pressure continues to mount over the markets. Moreover, the price dropped below the crucial support in the early trading hours and has failed to reclaim the lost levels, which indicates a tight bearish hold over the token. However, the market sentiments remain largely bullish, which suggests the BTC price could rise after the ongoing correction.
The Bitcoin’s recent drop isn’t directly attributed to a court decision on tariffs but rather to President Donald Trump’s announcement of imposing tariffs on Canada and Mexico. This move sparked widespread volatility across the markets, causing Bitcoin to plummet below $91,000 and resulting in nearly a billion dollars in total liquidations. Meanwhile, a recent US federal court ruling blocking Trump’s $10 billion tariffs has sparked optimism for Bitcoin’s future.
What’s Next- Will Bitcoin Rise to $120K or Drop to $100K?
The BTC price recently experienced a significant bullish push, probably due to the Golden Cross, which may soon turn into a death cross. The rising scepticism around the network has made the perp whales optimistic, while the spot traders are preparing for the new BTC highs. As per the data from Binance, the perpetual whales are defending $100K with bids, while spot sellers are looking to sell at $120K. With this, the BTC price forecast remains hung with both the possibility of forming a new ATH at $120K or plunging back to $100K.
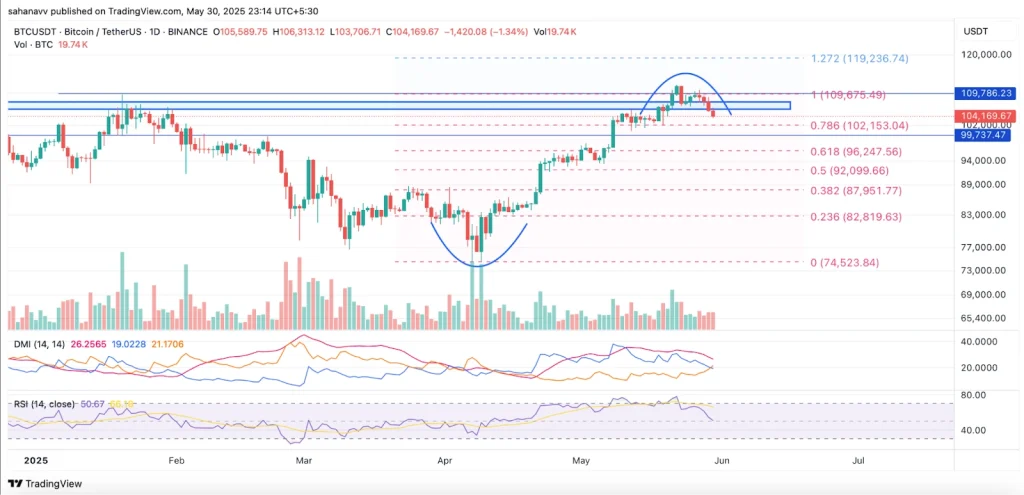
As seen in the above chart, the BTC price has displayed a similar divergence to that displayed in the first few days of April; however, it is reversed now. On the other hand, the DMI has displayed a bearish crossover while the RSI maintains a steep descending trend. Therefore, the bearish reversal may soon be validated while the price could head to the local support at $102,153 at 0.786 FIB. Here, if the price fails to trigger a rebound, it may drop below $100K, otherwise, a rebound could push it within the resistance zone between $105,937 and $107,615.
Now, all depends on the monthly close, which is required to be above the local support; else, the Bitcoin (BTC) price may witness a deeper correction.