- Yash Jain
 Yash Jain
- Mar 05, 2026 15:53 UTC
-
Bitcoin Price Debate Ignites as Bull Trap Warning Clashes With On-Chain Data

Over 30,000 BTC left derivatives exchanges near $72,900, signaling short covering.
About 8,000 BTC exited spot exchanges during February price lows, indicating accumulation.
Mining costs near $70K create a structural support level for the market.
The Bitcoin price is once again sitting in the middle of a classic crypto argument: bull trap or genuine recovery? One viral chart circulating on X claims the current rally perfectly mirrors the 2022 pattern and warns that BTC could crash to $45,000 within 12 days after a supposed bull trap near $73K.
That’s a dramatic call. But not everyone’s buying it. Because when you dig into the on-chain data, the story suddenly looks… a lot less catastrophic.
Bitcoin Price Bull Trap Or Reset?
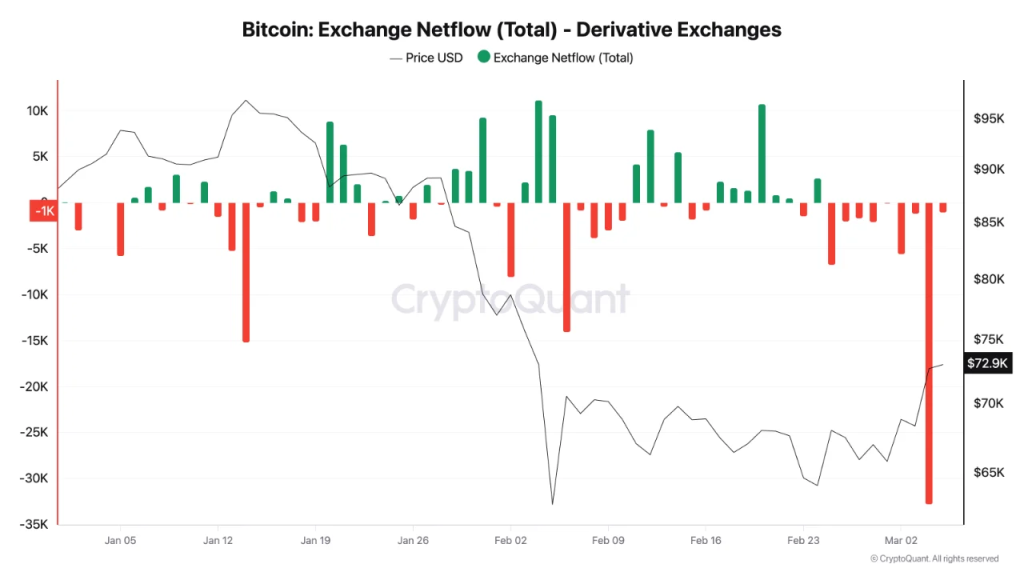
Let’s start with derivatives markets. According to CryptoQuant data, more than 30,000 BTC flowed out of derivatives exchanges as price approached $72,900 in early March 2026.
That’s not small change. Large derivatives outflows often indicate short covering, that means traders closing bearish positions rather than doubling down on them. In other words, some of the selling pressure that previously dragged the Bitcoin price chart lower may already be fading.
And that matters. A lot. Because, if major players considered the $65K–$68K zone a local bottom, then the current move higher might be less about hype and more about repositioning.
Quiet Accumulation Behind The Scenes
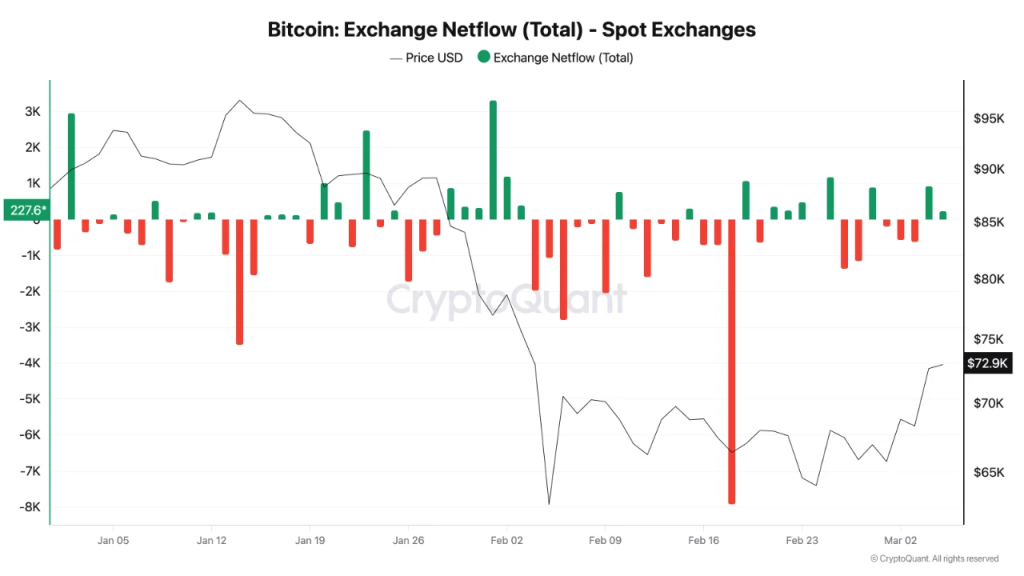
Then there’s spot market behavior. On February 18, roughly 8,000 BTC left spot exchanges right at price lows.
Not sold. Withdrawn. That pattern is often described as “stealth accumulation.” Institutions and large holders buy during weakness and move coins to cold storage rather than leaving them on exchanges where they could be dumped.
For anyone obsessing over a Bitcoin price prediction, that kind of behavior usually signals confidence rather than panic.
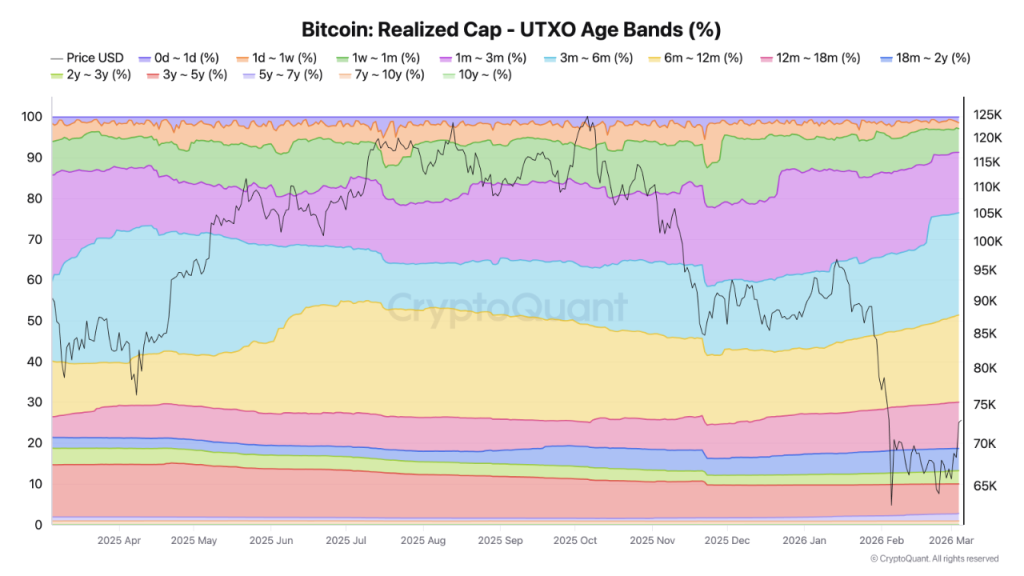
Meanwhile, long-term holders, the so-called diamond hands haven’t flinched.
Wallets holding coins for more than five years remain almost completely unchanged despite the volatility. Even the 6-month to 12-month holder group is expanding, suggesting some investors who bought last year’s volatility have simply transitioned into longer-term holders.
Not exactly the behavior you’d expect before a massive collapse.
Structural Support Around $70K
Now here’s the part traders keep watching. Mining economics. According to Marathon Digital filings, the average mining cost in Q4 2025 sat around $70,027 per BTC. With Bitcoin/USD hovering near $73,000, the margin above that break-even point is only about $3,000.
That level effectively becomes a structural floor.
Historically, if price drops below mining costs, miners can capitulate and sell reserves. But there’s a twist this cycle. Some miners are pivoting toward AI data centers, which may reduce the urgency to liquidate holdings during downturns.
So, what’s next? Well, Sentiment has already shifted from extreme fear to optimism, yet on-chain indicators still show accumulation rather than distribution.
The Bitcoin price might not be heading straight to the moon. But the data doesn’t scream imminent collapse either.
For now, the $70,000 line remains the battlefield. And the next move on the Bitcoin price chart will likely decide which side of the debate wins.
Trust with CoinPedia:
CoinPedia has been delivering accurate and timely cryptocurrency and blockchain updates since 2017. All content is created by our expert panel of analysts and journalists, following strict Editorial Guidelines based on E-E-A-T (Experience, Expertise, Authoritativeness, Trustworthiness). Every article is fact-checked against reputable sources to ensure accuracy, transparency, and reliability. Our review policy guarantees unbiased evaluations when recommending exchanges, platforms, or tools. We strive to provide timely updates about everything crypto & blockchain, right from startups to industry majors.
Investment Disclaimer:
All opinions and insights shared represent the author's own views on current market conditions. Please do your own research before making investment decisions. Neither the writer nor the publication assumes responsibility for your financial choices.
Sponsored and Advertisements:
Sponsored content and affiliate links may appear on our site. Advertisements are marked clearly, and our editorial content remains entirely independent from our ad partners.