- Sahana Vibhute
 Sahana Vibhute
- Oct 16, 2025 04:42 UTC
-
Bitcoin Price Analysis: Bearish Divergence Hints at a Possible Correction Ahead

Bearish RSI divergence suggests weakening momentum, hinting at a short-term correction despite Bitcoin’s higher highs near $115,900.
$110,000 support is crucial—a drop below could lead to a fall toward $95,000, while holding above may keep the path open toward $125,000.
The Bitcoin (BTC) price is showing signs of exhaustion after weeks of steady gains, hovering near $112,900 at the time of writing. Despite briefly testing highs above $115,900, the flagship crypto is struggling to maintain bullish momentum. Technical indicators now suggest a potential slowdown, as traders eye key support levels around $110,000. With market sentiment turning cautious, Bitcoin’s next move could determine whether it consolidates for another breakout or enters a short-term corrective phase.
Bearish Divergence Signals Possible Correction Ahead
The chart shared by analyst Ali highlights a striking similarity between Bitcoin’s current price structure and its 2021 market top. It shows that while Bitcoin’s price has been forming higher highs—currently peaking near $115,900—the Relative Strength Index (RSI) on the weekly timeframe has been printing lower highs, forming a clear bearish divergence. This indicates weakening buying momentum even as prices climb, often a precursor to a potential trend reversal or market correction.
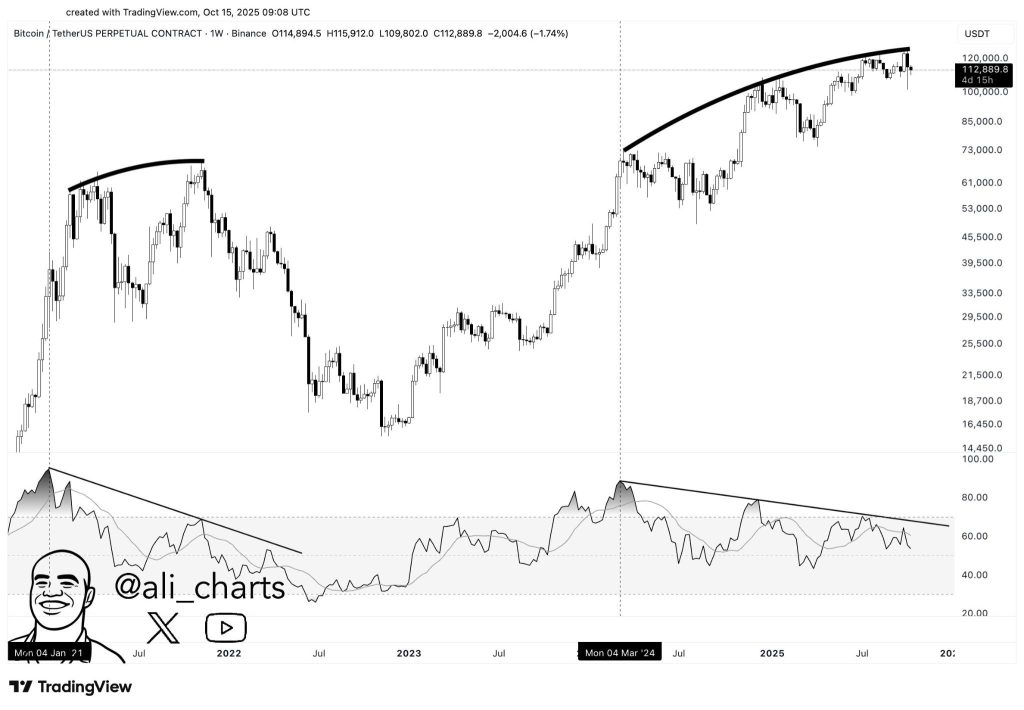
The chart also outlines a curved resistance pattern, suggesting Bitcoin could be forming a “rounded top.” This structure typically appears when upward momentum starts fading and sellers begin to take control gradually. If Bitcoin fails to sustain above $110,000, the bearish divergence could play out, leading to a deeper pullback toward the $95,000–$100,000 range. Conversely, a breakout in RSI above its descending trendline could invalidate the bearish scenario, signaling renewed strength and opening the path toward $125,000 and beyond.
Wrapping it Up
In conclusion, the Bitcoin price appears to be approaching a critical inflection point, with technical indicators flashing early warning signs of a possible trend reversal. The bearish divergence between BTC’s price and RSI suggests fading momentum, similar to patterns seen before previous market corrections. While Bitcoin remains fundamentally strong, a short-term pullback toward the $95,000–$100,000 range cannot be ruled out. Traders should stay cautious around the $110,000 support, as the next move will likely determine whether BTC resumes its rally or enters a consolidation phase.
Trust with CoinPedia:
CoinPedia has been delivering accurate and timely cryptocurrency and blockchain updates since 2017. All content is created by our expert panel of analysts and journalists, following strict Editorial Guidelines based on E-E-A-T (Experience, Expertise, Authoritativeness, Trustworthiness). Every article is fact-checked against reputable sources to ensure accuracy, transparency, and reliability. Our review policy guarantees unbiased evaluations when recommending exchanges, platforms, or tools. We strive to provide timely updates about everything crypto & blockchain, right from startups to industry majors.
Investment Disclaimer:
All opinions and insights shared represent the author's own views on current market conditions. Please do your own research before making investment decisions. Neither the writer nor the publication assumes responsibility for your financial choices.
Sponsored and Advertisements:
Sponsored content and affiliate links may appear on our site. Advertisements are marked clearly, and our editorial content remains entirely independent from our ad partners.