Vijay Gir

Vijay Gir

Author
- Dec 21, 2024 06:02 UTC
-
Bitcoin Stuck in Danger Zone: Will It Fall to $90K?

Bitcoin struggles to recover after a significant drop to $92,000.
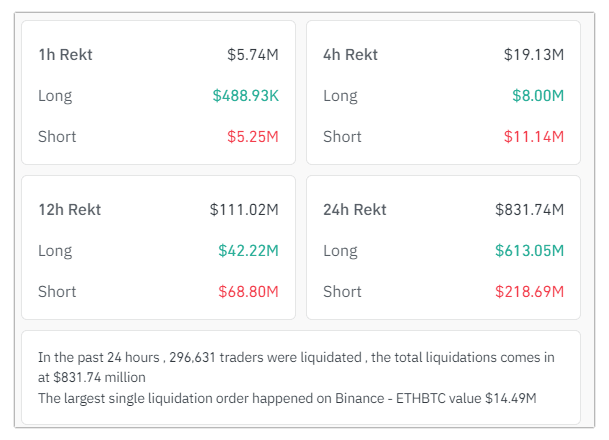
Liquidations continue to plague the market, with over $800 million wiped out in the last 24 hours.
Overcoming the 200-day moving average is crucial for a bullish reversal.
Bitcoin is struggling to recover after a steep drop that saw its price hit $92,000 yesterday, just as predicted in our analysis. Despite a modest 5% rebound, the cryptocurrency remains in a danger zone. Investors and traders are left on the edge.
Let’s break down the market metrics to see what’s happening and what could be next.
Critical Bitcoin Levels
Currently trading at $97,536, Bitcoin is attempting to climb higher but faces stiff resistance at the 200-day Moving Average (MA). While the Relative Strength Index (RSI) has exited the oversold zone, the risk of a pullback still looms large. Without enough buying volume, the MA 200 could push the price back down.
Previously, Bitcoin found support at $92,000, helped by the MA 50 on the daily chart. However, this time, that support may not be enough if selling pressure builds. Meanwhile, the Fear and Greed Index stands at 73, signaling moderate optimism, but overall sentiment remains bearish.
Catch the Warning Signs Early
The MACD histogram shows selling pressure is easing, but the Average Directional Index (ADX) has dropped to 33.62, which is concerning. Adding to the bearish outlook, the MA 20 has fallen below the MA 50 and MA 100, indicating weakness in the market trend.
If Bitcoin consolidates further or drops slightly, the smallest moving average could dip below the highest, sparking panic among traders. This scenario might lead to prices falling to $90,000—or even lower.
Wondering where Bitcoin is headed? Read Bitcoin price prediction to stay ahead of the market trends!
Liquidation Wave Hits Traders Hard
Over the past 24 hours, 296,631 traders were liquidated, wiping $831.74 million from the market, according to Coinglass. Yesterday, this figure exceeded $1 billion. Long traders, in particular, have suffered heavy losses over the past four days as the market continued to decline.
The liquidation map reveals that many traders are still placing high-leverage long bets on Bitcoin, with some using leverage as high as 100x. In a bearish market, these decisions highlight a lack of understanding of the risks involved.
The map also shows high-leverage short trades, which can create sudden price spikes as the market moves to liquidate positions with poor risk management. This volatility is common in periods of uncertainty.
What Bitcoin Needs to Recover
For Bitcoin to regain stability, it must break above the MA 200. Doing so would reduce negative sentiment and encourage new investors to enter the market. However, this requires an increase in buying volume, which is currently lacking.
A sudden spike could liquidate reckless short traders, providing temporary support, but a sustained recovery needs broader market participation. If Bitcoin remains stuck in this danger zone, it could drop to $90,000, triggering panic selling and further declines in altcoins.
Bitcoin is at a critical juncture. While it shows signs of potential recovery, the risk of a deeper drop remains. Traders and investors should watch key levels like the MA 200 and monitor buying volume closely. For now, caution remains the best strategy.
Never Miss a Beat in the Crypto World!
Stay ahead with breaking news, expert analysis, and real-time updates on the latest trends in Bitcoin, altcoins, DeFi, NFTs, and more.
FAQs
With a potential surge, the Bitcoin (BTC) price may close the month with a high of $110,000.
As per Coinpedia’s BTC price prediction, 1 BTC could peak at $169,046.
Projecting a 10-year growth in a volatile asset like Bitcoin seems a far-stretched notion. The BTC price is expected to cross $600,000 by 2030. With global adoption, Bitcoin could be worth 1 million dollars.
At the time of writing, 1 Bitcoin value was $98,125.20.