- Sahana Vibhute
 Sahana Vibhute
- Jan 20, 2026 14:19 UTC
-
Bitcoin (BTC) Price Slides Below $91K as Open Interest Rises—Is a Deeper Correction Ahead?
Bitcoin has entered a decisive range after a rejection near $98,000 and hence a breakdown below $90,000 may strengthen the bearish forces
Meanwhile, the derivative positions suggests the flushing isn’t done yet as leverage is still building into the dip
Fresh waves of bearish forces have captivated the crypto markets. The Bitcoin price is also facing significant upward pressure since the start of the day, with the sellers attempting to drag the price into the key support range below $90,000. While the market conditions are bearish, the bigger concern for the traders is not just the dip but what’s going on beneath. The derivatives are not cooled yet, while the BTC price maintains a steep bearish trend. This combination usually signals that leverage hasn’t flushed, keeping the downside risk alive.
Bitcoin Price Today: BTC Retests $91K as Bears Defend $98K Resistance
The BTC price has been printing consecutive bearish candles for nearly a week, hinting towards growing bearish influence over the token. With this, it has reached a pivotal price range, which has been a strong support earlier. But considering the current scenario, the rebound appears to be more distinct than expected. Currently, the Bitcoin price is trading at around $90,865 with more than a 2.6% pullback, flashing more bearish possibilities.
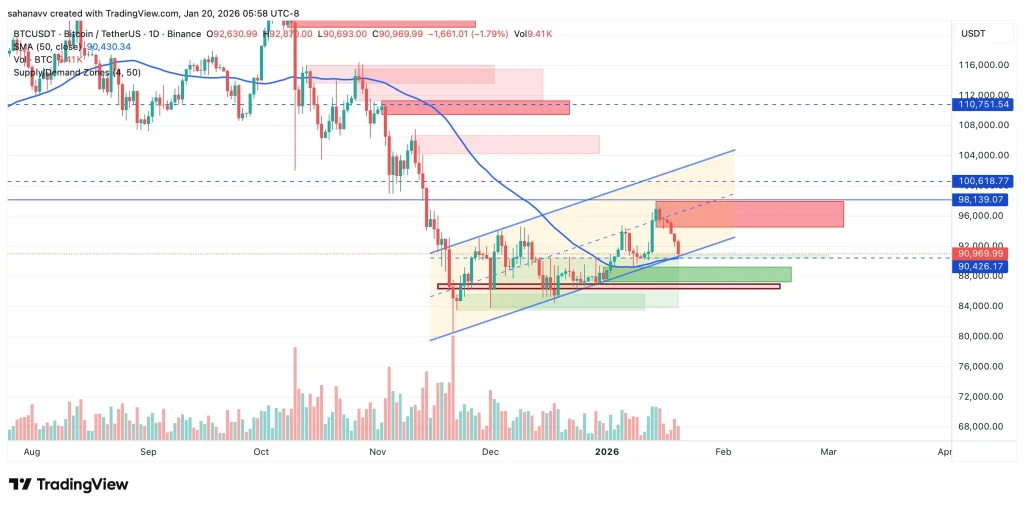
As seen in the above chart, the BTC price has tested the upper resistance of the rising channel soon after it rebounded from the lows close to $80,000. However, things changed when the price began to trade within the lower bands, signalling the draining strength of the bulls. Currently, the price is not only testing the lower support of the channel but also the 50-day MA at $90,430, which has been a strong base during the bearish events. On the other hand, the price is yet to enter the demand zone that sits just above the support zone between $86,400 and $86,700.
Therefore, a daily close below the 50-day MA may weaken the structure, extending the correction to the previous lows.
Why Bitcoin’s Selloff Doesn’t Look Like Capitulation Yet
Bitcoin is sliding again, but the derivatives data suggest this isn’t a full panic flush. Open interest is rising as price falls, funding remains slightly positive, and long liquidations are still relatively small. That combination typically signals leverage hasn’t fully reset, keeping the risk of another downside sweep on the table. The Price vs OI setup is the key reason traders are staying cautious.
Rising Open Interest During a BTC Dip = New Leverage Entering
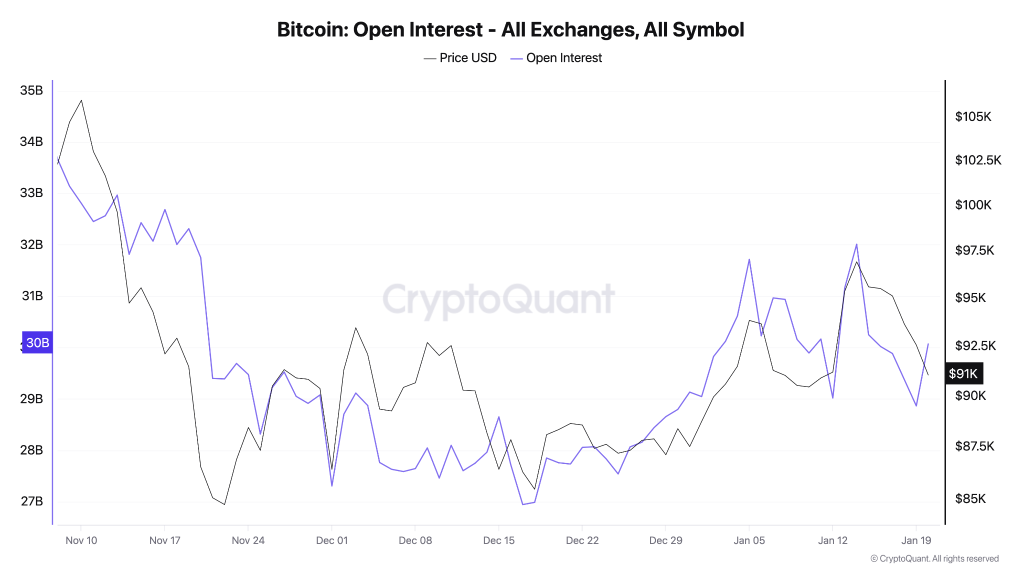
When open interest increases while BTC price drops, it typically means traders are opening new positions into the decline rather than closing risk. That usually keeps volatility elevated because leverage can be forced out later.
Positive Funding (0.003) Suggests Longs Still Leaning In
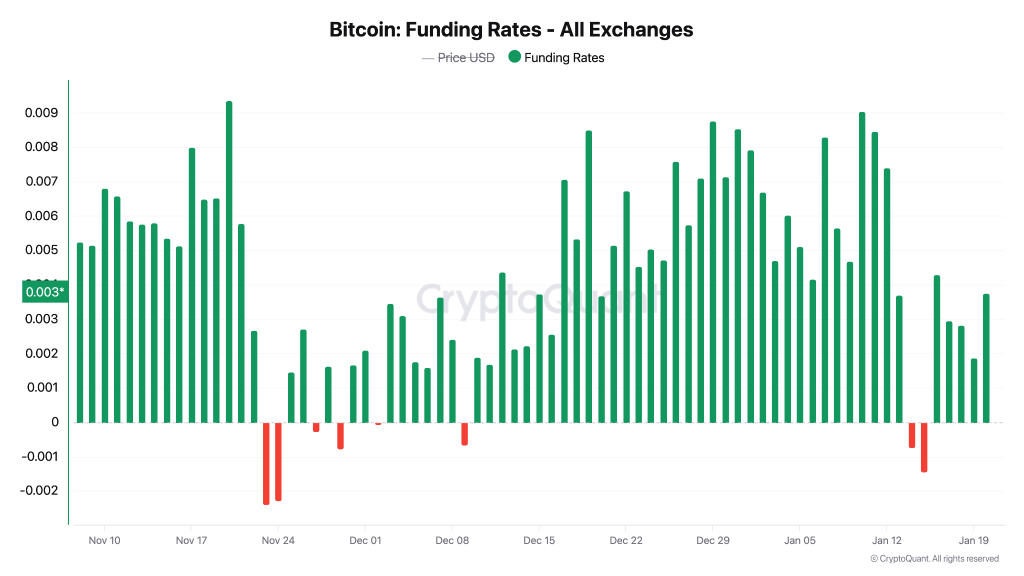
Funding staying positive while the price falls often implies the market is still slightly long-skewed. In a true washout, funding commonly cools sharply or flips negative as longs exit and shorts dominate.
Long Liquidations (~2K) Are Too Small for a “Flush” Bottom
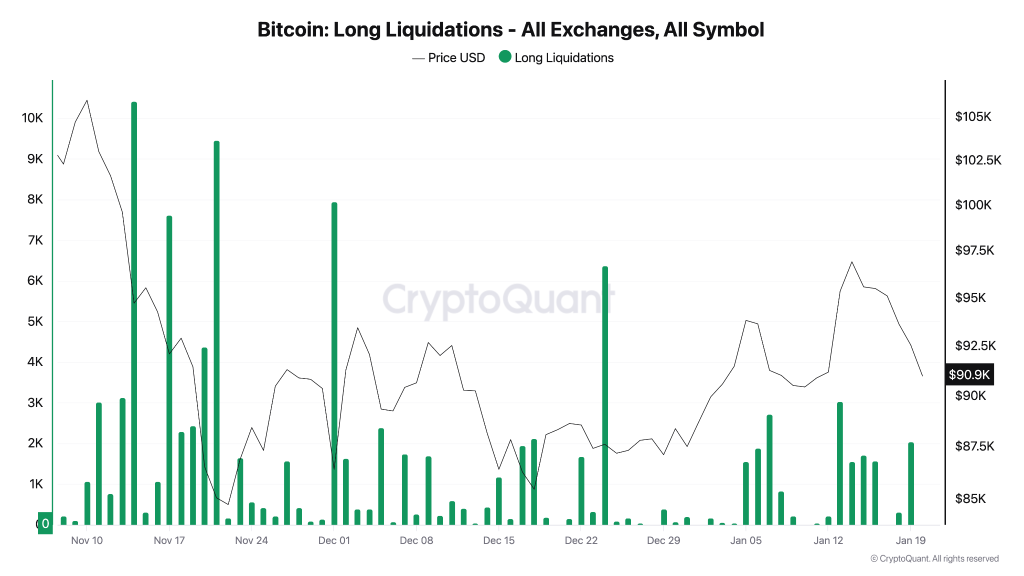
The long liquidation chart shows recent liquidations are mostly ~1K–3K, nowhere near the earlier large spikes. That supports the “not capitulation” read: the market hasn’t seen a forced liquidation event big enough to reset positioning.
The above charts suggest the BTC price is dropping, but leverage has not cleared. That makes the current support test more dangerous, because the market may still need a sharper shakeout to fully reset sentiment.
Bitcoin at a Key Support, But Leverage Signals Raise Downside Risk
Bitcoin price is approaching a decisive support zone near $90K–$88K after failing to break through $98K resistance. While the chart shows a critical demand band that could spark a bounce, the Price vs OI data suggests this selloff is not capitulation yet. Rising open interest, positive funding, and relatively light long liquidations imply leverage remains in the system. If support holds and BTC reclaims $98K–$100.6K, a recovery toward $110.7K is back on the table. If it breaks, the market may need a deeper flush before a durable bottom forms.
Trust with CoinPedia:
CoinPedia has been delivering accurate and timely cryptocurrency and blockchain updates since 2017. All content is created by our expert panel of analysts and journalists, following strict Editorial Guidelines based on E-E-A-T (Experience, Expertise, Authoritativeness, Trustworthiness). Every article is fact-checked against reputable sources to ensure accuracy, transparency, and reliability. Our review policy guarantees unbiased evaluations when recommending exchanges, platforms, or tools. We strive to provide timely updates about everything crypto & blockchain, right from startups to industry majors.
Investment Disclaimer:
All opinions and insights shared represent the author's own views on current market conditions. Please do your own research before making investment decisions. Neither the writer nor the publication assumes responsibility for your financial choices.
Sponsored and Advertisements:
Sponsored content and affiliate links may appear on our site. Advertisements are marked clearly, and our editorial content remains entirely independent from our ad partners.