Sohrab Khawas

Sohrab Khawas

Author
Sohrab is a passionate cryptocurrency news writer with over five years of experience covering the industry. He keeps a keen interest in blockchain technology and its potential to revolutionize finance. Whether he's trading or writing, Sohrab always keeps his finger on the pulse of the crypto world, using his expertise to deliver informative and engaging articles that educate and inspire. When he's not analyzing the markets, Sohrab indulges in his hobbies of graphic design, minimal design or listening to his favorite hip-hop tunes.
- Oct 14, 2023 07:56 UTC
-
SOL Price Analysis: Buyers Kick Back, Solana Eyes $30?
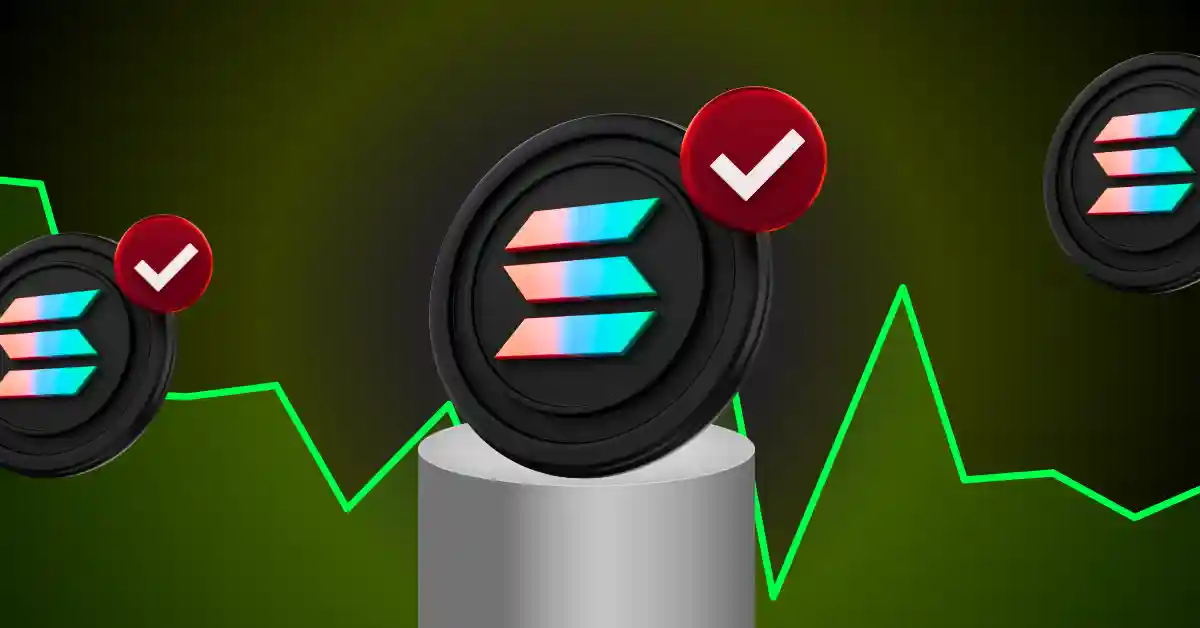
SOL price action displays a retest of the $22 mark as it bounces from the 50-day EMA.
The price jump keeps the hope for a golden crossover alive.
A reversal rally will fuel the Solana uptrend to cross the $30 mark.
Starting the Asian markets on a bullish note, the SOL price jumps sharply overnight. With 2.58%, Solana prices overcome the bearish clouds set by the 3.27% on Thursday. Further, the buyers assert dominance over the 50-day EMA and propel the bounceback.
With the buyers back in play, the possibility of a high-spirited Uptober rally increases and improves the overall sentiment. Further, the ongoing uptrend supports the Solana price prediction, anticipating a bullish journey above $30 in the upcoming altseason.
As the SOL price jumps from the 50-day EMA, the $22 mark and the resistance zone prove crucial once again. The price jump comes as a retest and keeps the guillotine of post-retest reversal intact.
Currently, the Solana prices trade at $22.05 with an intraday growth of 0.92%, teasing a potential uptrend in the coming days. Further, the channel breakout in the daily chart remains prominent and hints at an uptrend to $30.
However, the possibility of an uptrend facing opposition at $25 is notable and teases a potential double top reversal in SOL price if the market faces another hiccup.
Technical Indicators:
EMA: The proximity of the 50-day and 200-day EMA signal increases the possibility of a golden crossover.
RSI indicator: The RSI indicator reverses sharply from the overbought zone to fall below the 14-day SMA. However, the RSI line remains above the halfway line, indicating that there is still bullish momentum left in the uptrend.
Will the SOL Price Reach $30?
If the SOL price remains above the 200-day EMA, the likelihood of an uptrend continuing to the $28 level is significantly higher. Furthermore, the uptrend could result in a golden cross and start a bullish chain reaction to reclaim further resistance levels.
However, if the downtrend continues below the key EMAs, it could jeopardize the bullish dominance at the psychological level of $20. In such a case, the Solana price might retest at $19.45