Sohrab Khawas

Sohrab Khawas

Author
Sohrab is a passionate cryptocurrency news writer with over five years of experience covering the industry. He keeps a keen interest in blockchain technology and its potential to revolutionize finance. Whether he's trading or writing, Sohrab always keeps his finger on the pulse of the crypto world, using his expertise to deliver informative and engaging articles that educate and inspire. When he's not analyzing the markets, Sohrab indulges in his hobbies of graphic design, minimal design or listening to his favorite hip-hop tunes.
- Sep 18, 2023 06:04 UTC
-
BTC Price Analysis: Is A Bear Trap Set For Bitcoin Price At $26K?
Bitcoin price finds a bullish momentum surge last week but faces a silent weekend.
With a new consolidation range, the death cross warns a nosedive.
A downfall below $26K can start a bearish rally fueled by the deathcross.
Amidst the recent bustling market, Bitcoin price demonstrated a notable 2.74% surge last Tuesday. This uptick has further emboldened the bullish momentum, thrusting Bitcoin price past the $26,600 threshold, marking an impressive 5.88% increase over the past week.
Yet, the weekend witnessed a slight deceleration in trading volume, hinting at a subdued bearish sentiment, mirrored by the appearance of a few doji red candles.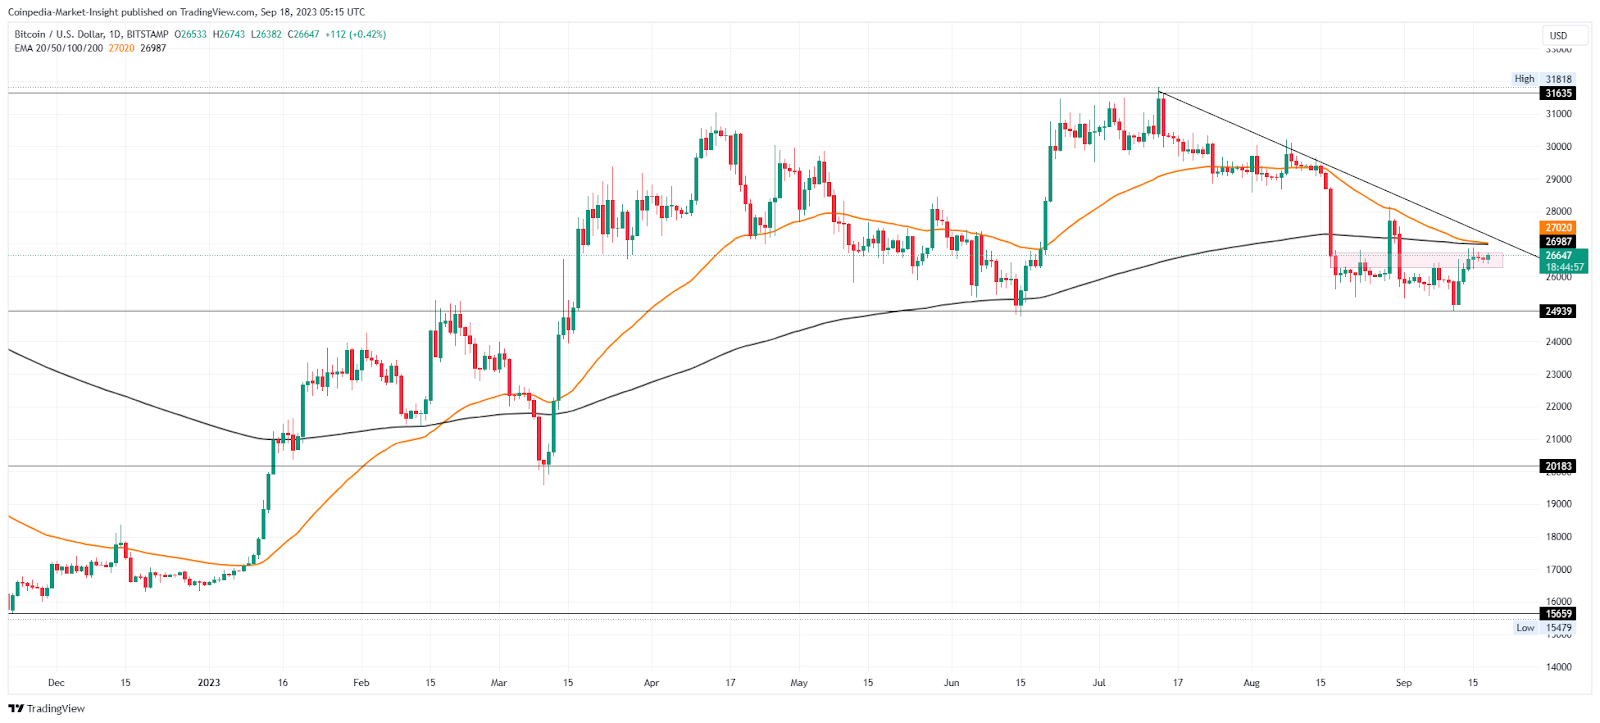
As we enter new week, Bitcoin price refuses to bow down, marching on with an intraday surge of 0.51%. At present, it’s trading hands at $26,670, forming an optimistic bullish candle, mitigating the minor pullback seen over the weekend.
A close inspection of the 50 and 200-day EMAs reveals a looming convergence, flagging potential for a death cross. Concurrently, an impending resistance trendline hovers just above the interplay of the EMAs as the next bearish hurdle for Bitcoin price.
Contrary to the daily chart, the technical 4-hour chart shows the high possibility of a golden crossover with the recent recovery. The consolidation zone of Bitcoin price is pinned between $26,274 and $26,730. A breakout in either direction will fuel Bitcoin’s next big move.
However, the upside breakout is ready to face the opposition from the resistance trendline and the EMAs.
Technical indicators:
Relative Strength Index: The daily RSI presents a bullish front as it bounces above the halfway line.
MACD: MACD and signal lines maintain a positive trend with rising bullish histograms.
Therefore, the momentum indicators display a bullish point of view.
Where is the Bitcoin Price Heading?
With multiple lower price rejection candles, the bullish breakout possibility increases for the Bitcoin price trend. Considering the range breakout rally surpasses the resistance trendline breakout, the BTC price can reach the $30,000 mark.
On the bottom side, a breakdown below $26,274 can lead to a nosedive to $25,600 or $24,900.