Vijay Gir

Vijay Gir

Author
- Nov 18, 2024 06:35 UTC
-
Render Token (RNDR) Hits $7.65: Price Analysis & Key Levels to Watch

Render Token (RNDR) has surged 8.64% in 24 hours, breaking through key resistance levels and sparking optimism among investors.
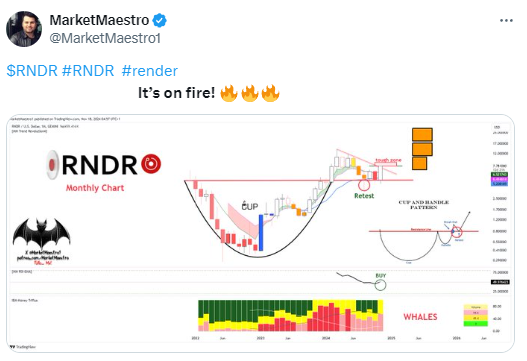
The token has formed a bullish Cup and Handle pattern, and technical indicators like RSI and CMF suggest continued upward momentum.
However, declining daily active addresses raise concerns about the sustainability of the rally.
Render Token (RNDR) is on the move again, surging by 8.64% in just 24 hours to hit $7.65. After months of struggling to break free from resistance, this sudden rally has sparked fresh optimism among traders.
But with major hurdles ahead, is this the start of a sustained climb, or just a short-lived spike? Can RNDR maintain its momentum?
Keep reading to discover the key factors driving this move and what’s next for the token.
Breaking Through the Resistance
It’s been a tough few months for RNDR. The token had been stuck in a descending channel, unable to make any real progress. But this week, it broke through a key resistance level at $6.67, which had been holding it back for some time. This move was a major win for buyers, boosting confidence in the market.
An X user, known for sharing insightful charts, also pointed out a Cup and Handle formation on RNDR’s chart, further supporting the bullish outlook.
This rally didn’t come out of nowhere. The $4.00 support level proved to be a strong base, giving buyers the confidence to enter the market. With this foundation in place, RNDR is now eyeing $12.05, a resistance level where sellers have previously dominated.
It won’t be an easy climb, but the current momentum looks strong—at least for now.
Why the Buzz Around RNDR?
There’s been a lot of activity in the market. Trading volumes spiked as RNDR made its move, showing that interest in the token is high. From a technical perspective, things are also looking positive. The 20-day moving average (MA) has already crossed above the 50-day and 100-day MAs, and it’s now on track to cross the 200-day MA soon. This indicates rising momentum for RNDR.
The Relative Strength Index (RSI) is currently at 64.18. While still in the bullish zone, it’s getting close to overbought territory. Additionally, the Chaikin Money Flow (CMF) sits at 0.28, suggesting that capital is flowing into RNDR. These signals point to a continued rally, though, as always, nothing is guaranteed.
Decline in Active Addresses: A Concern?
There is one worry: daily active addresses have dropped sharply, from 703 to just 209. A decline in active users could signal that the rally might slow down or even pause. This is a key factor to watch in the coming days, as it could affect the rally’s momentum.
A Rally Worth Watching!
RNDR is now heading toward some tough resistance levels. The next hurdles are at $9.47 and $11.22, with the big challenge coming at $12.05. If RNDR can push through these levels, it could set its sights on its all-time high of $13.29. But nothing is certain in the world of crypto.
For this rally to continue, buyers will need to stay active. If demand drops, RNDR could get stuck below $12.05. With strong technical indicators and solid support behind it, the token has the potential for further gains.
RNDR’s path forward promises to be a thrilling ride for traders and investors alike.