Sohrab Khawas

Sohrab Khawas

Author
Sohrab is a passionate cryptocurrency news writer with over five years of experience covering the industry. He keeps a keen interest in blockchain technology and its potential to revolutionize finance. Whether he's trading or writing, Sohrab always keeps his finger on the pulse of the crypto world, using his expertise to deliver informative and engaging articles that educate and inspire. When he's not analyzing the markets, Sohrab indulges in his hobbies of graphic design, minimal design or listening to his favorite hip-hop tunes.
- May 20, 2024 09:46 UTC
-
HBAR Price Under Pressure Warns $0.10 Crackdown

HBAR price shows a potential double top under construction.
The HBAR token price could drop under the $0.10 mark if the supply pressure grows.
If the HBAR price cracks under $0.10, the next support is at $0.080.
With the broader market rally taking a small pause over the weekend, the uptrend in altcoins takes a pause as well. Amidst the slowdown, the HBAR price trend stands at a crossroads, as the price action shows a critical stage.
As the bullish trend in the Hedera token faces solid supply pressure at higher levels, the uptrend is under question. Will the bull run continue for this altcoins with the broader market recovery? For long-term analysis, check out our HBAR price predictions that hint at a bull run to $1.
Is Hedera Taking A Quick Reversal?
Following the double bottom breakout rally in the weekly chart, the HBAR price trend sustains the bullish momentum. The uptrend in the Hedera token forms a higher high trend after the post-retest reversal to reclaim the $0.10 psychological mark.
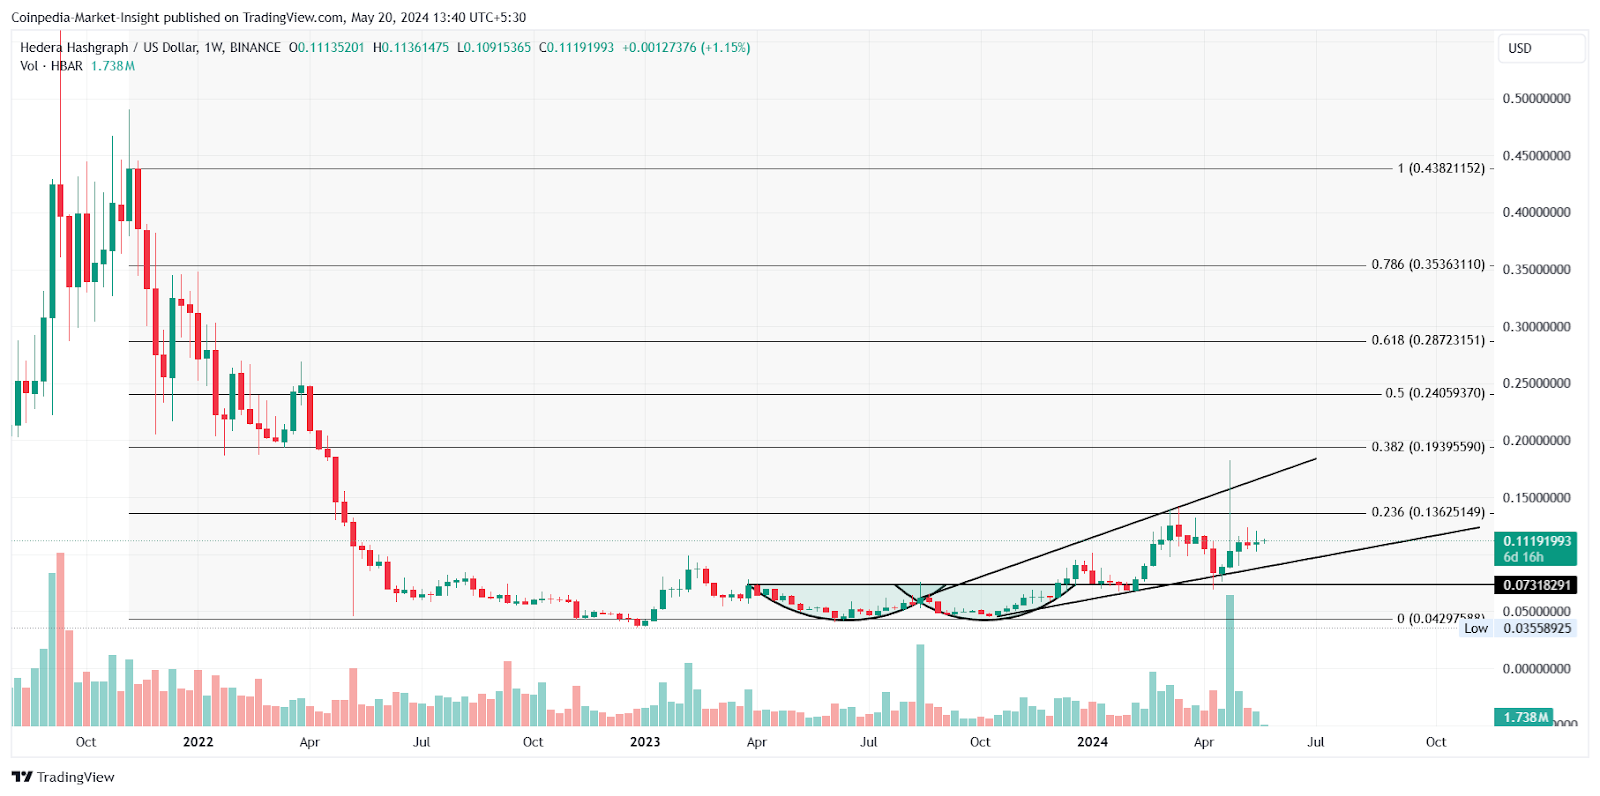
Furthermore, the HBAR price action forms a bullish expanding channel with two diverging ascending trendlines. However, the intense supply overhead at the $0.13 mark warns of a double top reversal.
Currently, the Hedera token trades at $0.112 with an intraday gain of 1.63%. However, the weekly chart shows Doji candles forming near the crucial resistance that warns of a bearish reversal.
Technical indicator:
RSI indicator: The daily Relative Strength Index (RSI) shows a sideways trend above the halfway line.
DMI Indicator: The closing VI lines warn of a weakness in the bullish trend.
Will HBAR Price Sustain Above $0.10?
With the weekly trend reflecting a bullish weakness, the HBAR token price might soon take a bearish turn. A double top reversal might result in a drop to the ascending support trendline and crack under the crucial $0.10 psychological mark.
In such a case, the downtrend motion could retest the $0.080 support, an extension of 20% crash. On the uspide, a bullihs continuation could reclaim the $0.20 mark by the end of Q2.