- Vignesh S G
 Vignesh S G
- Apr 01, 2025 12:00 UTC
-
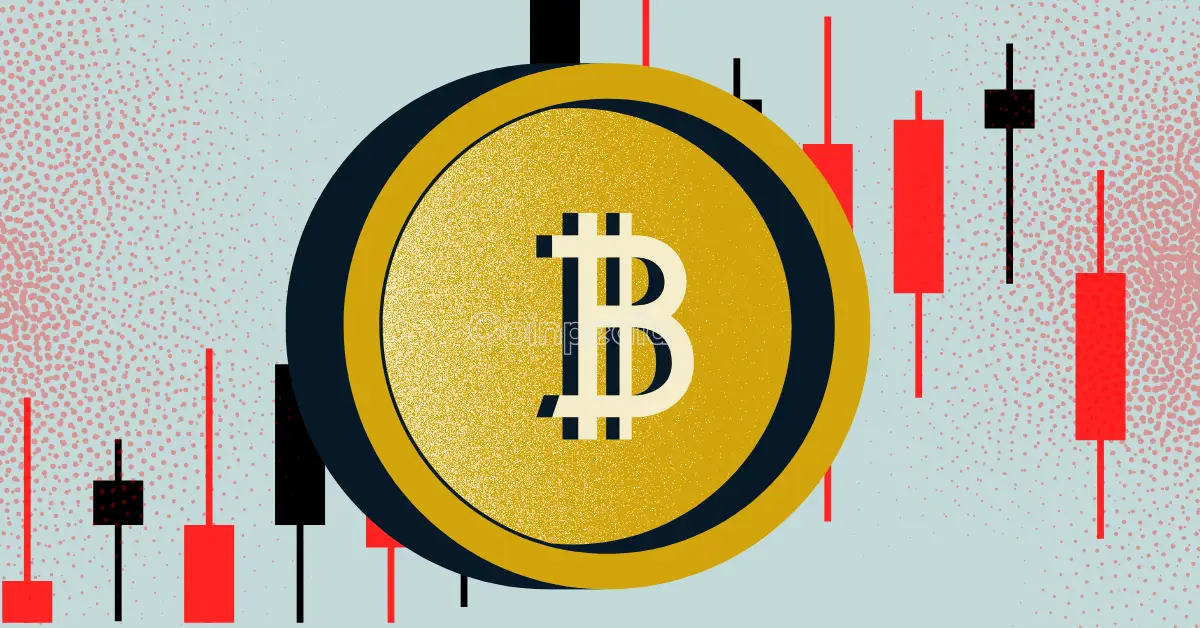
Can Bitcoin Price Reverse Soon? Watch These Indicators
-
 BTC $ 117,669.56 (1.22%)
Bitcoin's recent price drop correlates strongly with declining global liquidity, which is now showing signs of bottoming out.
Key indicators like resistance levels, exchange flows, moving averages (golden cross), and RSI should be monitored.
If global liquidity improves, there is a high probability of Bitcoin seeing a price reversal and upward trend.
Bitcoin is currently trading 22.94% below its all-time high and about 1.84% lower than its closing price on March 1. With the US stock market also down 6% this month, many are wondering what’s next for the cryptocurrency. Experts point to a sharp drop in global liquidity as a major factor behind the recent downturn. But here’s the catch – reports suggest global liquidity may have finally hit rock bottom. Does this mean a potential turnaround for Bitcoin?
Stick with us to discover what’s happening behind the scenes and what signs you need to watch for a possible recovery.
Global Liquidity: A Turning Point?
Reports indicate that global liquidity has likely bottomed out, which could mean it’s about to rise again. This is a significant development for Bitcoin, as the flow of global liquidity plays a key role in its price movement.
Experts note that Bitcoin and global liquidity have an 80% correlation—a very high figure. This suggests there’s an 80% chance that Bitcoin’s price could increase if global liquidity improves. This connection provides a strong basis for optimism about Bitcoin’s future performance.
Key Indicators to Watch for a Bitcoin Price Rally
To understand whether Bitcoin might see a price increase soon, here are the main indicators to monitor:
Resistance Level
Bitcoin is currently priced at $84,185.01. Analysts have identified several resistance levels: $87K, $90K, $92.5K, $94K, $95K, and $100K. If Bitcoin breaks through these levels with strong trading volume, it suggests that buying pressure is overcoming selling pressure, which could push the price higher.
Bitcoin Exchanges’ Net Flow
When investors move their Bitcoin away from exchanges, it often suggests they are confident about the long term potential of the asset. Therefore, it is important to monitor the flow of Bitcoin onto and off cryptocurrency exchanges.
According to Coinglass, the total exchange balance of BTC sits at 2,197,123.37. Its 24-hour change is +16629.17, and its 7-day change is -7184.75. Yesterday, the Bitcoin Wallet net flow was +3.81K BTC.
Technical Indicators
A golden cross, where a shorter-term moving average crosses above a longer-term one is often seen as a bullish signal. The SMA-50 of BTC remains at $88,254.66, and the SMA-200 of the asset stands at $86,180.45.
BTC’s RSI remains at 46.57. If the RSI moves consistently above the neutral 50 level and heads towards overbought territory (above 70), it can indicate increasing buying momentum.
As the liquidity tide shifts, Bitcoin could very well be gearing up for its next big move – let’s see if it breaks free or stalls again.
Never Miss a Beat in the Crypto World!
Stay ahead with breaking news, expert analysis, and real-time updates on the latest trends in Bitcoin, altcoins, DeFi, NFTs, and more.
FAQs
As global liquidity recovers, Bitcoin prices are expected to rise due to the high correlation between liquidity and Bitcoin’s value.
As per Coinpedia’s BTC price prediction, 1 BTC could peak at $169,046 this year if the bullish sentiment sustains.