



 Advertise



Five Numbers From SimpleSwap That Change How You Read a Falling Market



Sara is steadily working on cryptocurrency evaluations, news, and fluctuations in digital currency prices. She is guest author associated with many cryptocurrencies admin and contributes as an active guide to readers about recent updates on virtual currencies.


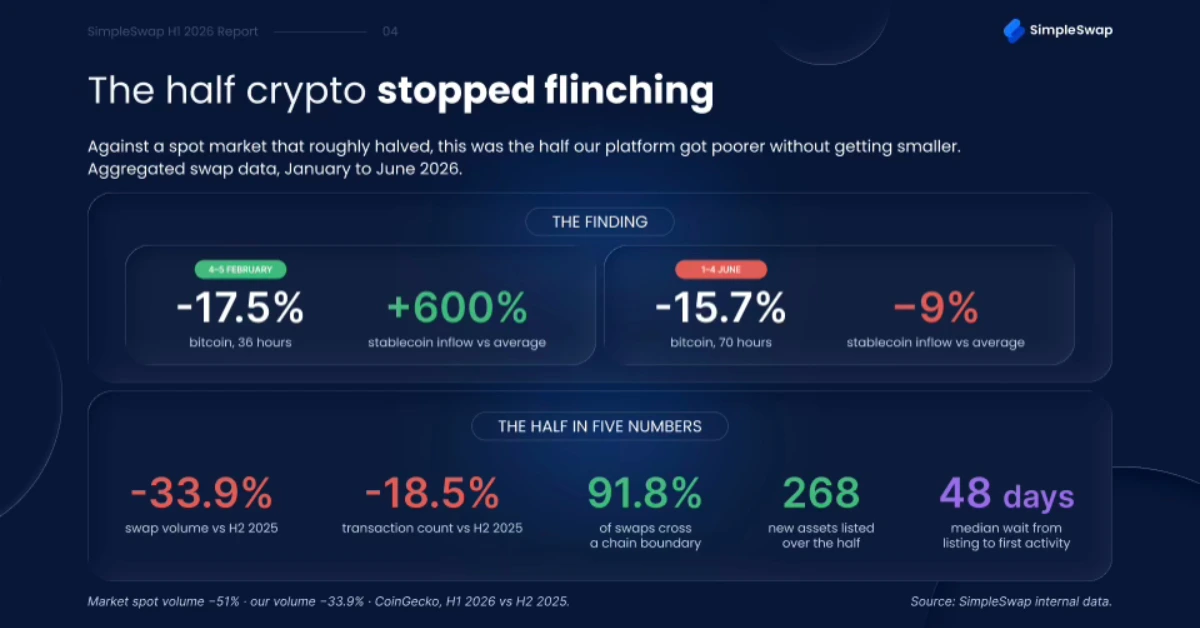
Standfirst: A new report from swap aggregator SimpleSwap sets each of its findings against a public benchmark. Here are the five that matter, with the market number next to each.
The H1 2026 Swap Report by SimpleSwap covers 1 January to 30 June, is benchmarked against the second half of 2025, and uses a different methodology than earlier editions. Each section opens with a public market figure before any platform number appears, as shown below.
−33.9%
Swap volume in the first half of 2026 fell by a third compared with the second half of 2025. The market fell much further. Spot volume on the top centralized exchanges dropped from roughly $9.5 trillion to about $4.65 trillion by CoinGecko’s count, a decline of nearly 51%, with March and May printing the weakest monthly readings since late 2023. Total crypto capitalization closed the half around $2.1 trillion, about 30% below where it began the year.

A platform falling 17 points below its own market is not a platform losing customers. It is a platform whose customers stayed and brought less.
−18.5%
Transaction count fell far less than volume, which is where the previous number gets its meaning. Average swap size dropped 18.9%, and the median dropped 17%. Those two moving together rules out the obvious alternative explanation. Had the half-thinning been due to large users leaving, the average would have fallen much further than the median.
The catalog confirms this. Assets in active use fell from 1,392 to 1,333, a 4.2% decline, while active pairs dropped from 21,138 to 17,857, down 15.5%. Traders kept nearly the entire vocabulary and built fewer sentences from it.
268
New assets became routable over the half, about ten a week. The median one then waited 48 days for its first meaningful activity, measured against a fixed threshold applied identically to every asset. The fastest reached that threshold in 101 hours, and the five quickest all did so within a week.
The gap between the quickest and the median runs about elevenfold, which says more about how unevenly attention lands on new tokens than about how fast a venue can move. Meanwhile, the market’s noisiest segment barely registered here. Memecoins came to 1.1% of volume and 1.4% of transactions during a half when launchpad activity was hitting record daily volumes, and a single launchpad accounted for roughly half of Solana’s weekly decentralized turnover at the February peak.
91.8%
Share of swaps that crossed a network boundary, up 0.4 points on the previous half and holding between 90.3% and 93.3% every month. The deeper figure is the reach of smaller networks: 71.4% of transactions and 74.4% of volume touched at least one chain outside the four largest, which is more than double the reach of Ethereum.
The industry moved the same way. Cross-chain volume has grown roughly a hundredfold since 2022, with peak weeks above $10 billion by LI.FI’s count, and Circle’s cross-chain transfer protocol handled more than $110 billion in the months after its November 2025 relaunch.
48 days
The median wait from listing to first use, and the number the report treats as its most useful operational finding. Two clocks run here. The listing clock belongs to the venue. The demand clock belongs to the market, and no venue controls it.
The report concludes that asymmetry favors listing early, since carrying an unused route costs almost nothing while missing one costs users. That aligns with another divergence: Bitcoin dominance broke above 60% this half, yet Bitcoin and Ether’s share of platform volume fell 5.2 points to 43.4%. Dominance shows where value sits, while an aggregator measures when value moves.
One more, off the list
The report’s own headline finding does not fit into five numbers, so it gets a sixth. Stablecoin inflows stopped responding to Bitcoin falling partway through the half. In early February, Bitcoin dropped 17.5% over 36 hours, and inflows ran 600% above their weekly average. In early June, it dropped 15.7% over 70 hours, and the same flows came in 9% below average. Two other aggregators checked their own books and confirmed the February surge, and public sentiment data traced the same fade, with the Fear & Greed Index printing an all-time low of 5 in February against only the low teens in June.
Six sections make up the report, covering volume, asset rotation, stablecoin flows, sentiment, new listings, and network reach, along with partner data from four other aggregators and one wallet.
About the report
The SimpleSwap H1 2026 Swap Report covers 1 January to 30 June 2026 and is benchmarked against the second half of 2025. Every section opens with a public market benchmark before any internal figure appears, and all platform figures are aggregated shares, ratios, and rates of change rather than dollar totals. Nothing in the report identifies a user, an address, or the timing of an individual transaction, and the report contains no price forecasts.
Full report and methodology at SimpleSwap blog. Media and analysts can request additional data cuts at [email protected].
About SimpleSwap
SimpleSwap is a self-custodial multi-source swap aggregator. It draws liquidity from more than 20 CEX and DEX sources, covers 2,800+ assets, and handles provider and route selection under the hood. Over 8 years, 10M+ users have swapped through SimpleSwap, and 6,000+ projects use it as a business solution, including Exodus and Tangem. The only official SimpleSwap website is simpleswap.io.
Was this writing helpful?

Trust with CoinPedia:
CoinPedia has been delivering accurate and timely cryptocurrency and blockchain updates since 2017. All content is created by our expert panel of analysts and journalists, following strict Editorial Guidelines based on E-E-A-T (Experience, Expertise, Authoritativeness, Trustworthiness). Every article is fact-checked against reputable sources to ensure accuracy, transparency, and reliability. Our review policy guarantees unbiased evaluations when recommending exchanges, platforms, or tools. We strive to provide timely updates about everything crypto & blockchain, right from startups to industry majors.
Investment Disclaimer:
All opinions and insights shared represent the author's own views on current market conditions. Please do your own research before making investment decisions. Neither the writer nor the publication assumes responsibility for your financial choices.
Sponsored and Advertisements:
Sponsored content and affiliate links may appear on our site. Advertisements are marked clearly, and our editorial content remains entirely independent from our ad partners.