- Yash Jain
 Yash Jain
- Jan 29, 2026 16:21 UTC
-
Solana Price at $116: Breakout Launchpad… or Breakdown Before the Next Leg?
Solana price at $116 is at a decision zone, where price action point toward an imminent high-volatility move.
On-chain data confirms smart-money accumulation.
Technical indicators signal seller exhaustion, not panic.
After weeks of persistent selling pressure and failed recovery attempts, Solana holders are once again staring at a brutal question: Is this consolidation the final reset before a powerful breakout in Solana price or just the pause before another downside flush?

With Solana price today hovering near $116, the market is approaching a point where indecision will no longer be an option. This article is no longer about optimism or fear. It’s about structure and price action.
Why This Zone Matters More Than It Looks
From a technical perspective, momentum still appears fragile but cracks are forming beneath the surface.
Among the top technical indiactors on weekly chart, RSI is printing around 36, hovering just above oversold territory. Historically, this region has often marked seller exhaustion rather than trend continuation, particularly when price holds above a known demand zone. Meanwhile, MACD remains below the signal line, but the histogram is flattening, showing that bearish momentum is slowing rather than accelerating.
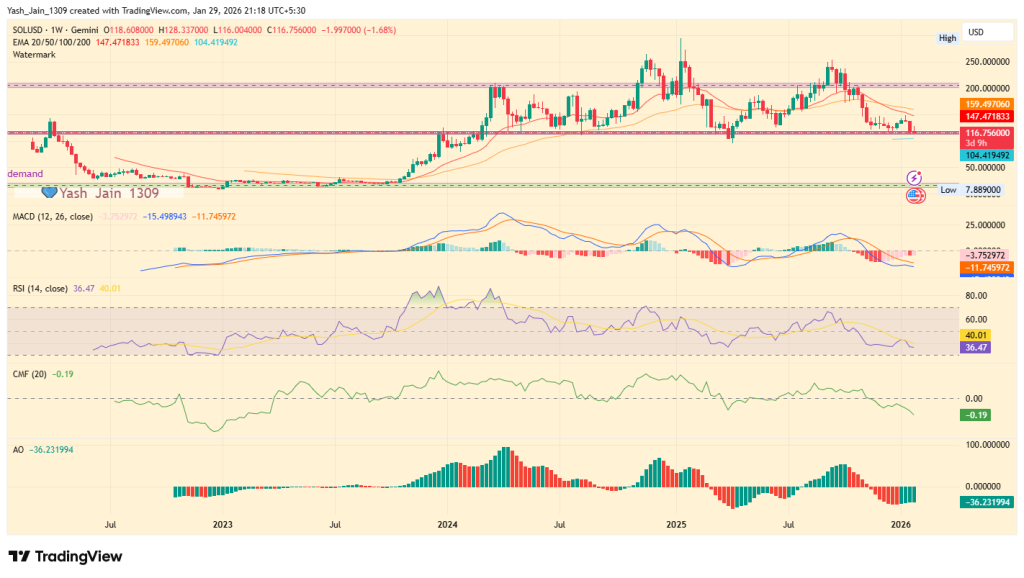
The Awesome Oscillator (AO) reinforces this view. Although still deep in negative territory, the red bars are shrinking, hinting that downside force is losing intensity. At the same time, Chaikin Money Flow (CMF) sits near -0.19, signaling capital outflows but notably not aggressive liquidation. In past cycles, similar CMF behavior during price compression has preceded volatility expansion.
Price action itself adds another layer. With CMP at $116, Solana price is sitting directly inside a historically defended zone that previously acted as a springboard for larger moves since last 24 months.
The On-Chain Signal Most Are Missing
While Solana price charts suggest hesitation, on-chain data paints a very different picture.
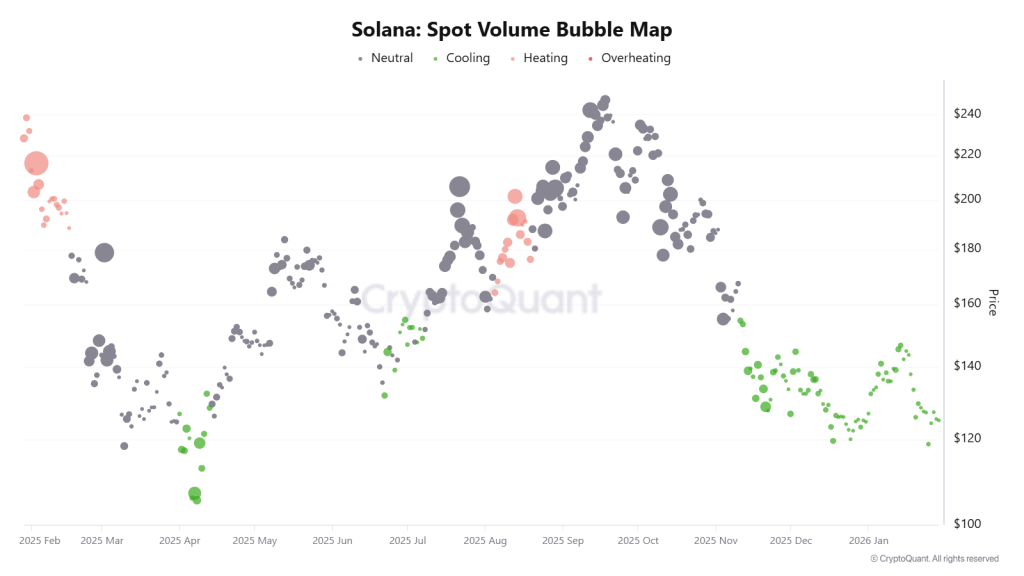
Both spot and futures Volume Bubble Maps show dense clusters of green bubbles between $110 and $150, signaling high-volume activity during a “cooling” phase. This pattern typically reflects supply absorption rather than speculative excess. In simple terms, strong hands appear to be accumulating while volatility remains suppressed.
Derivatives data strengthens this narrative. Spot Taker CVD has turned positive and continues to rise, confirming a Taker Buy Dominant environment since early January. Even more telling, Futures Taker CVD has maintained this bullish bias since December 2025, suggesting sustained institutional conviction rather than short-term positioning.
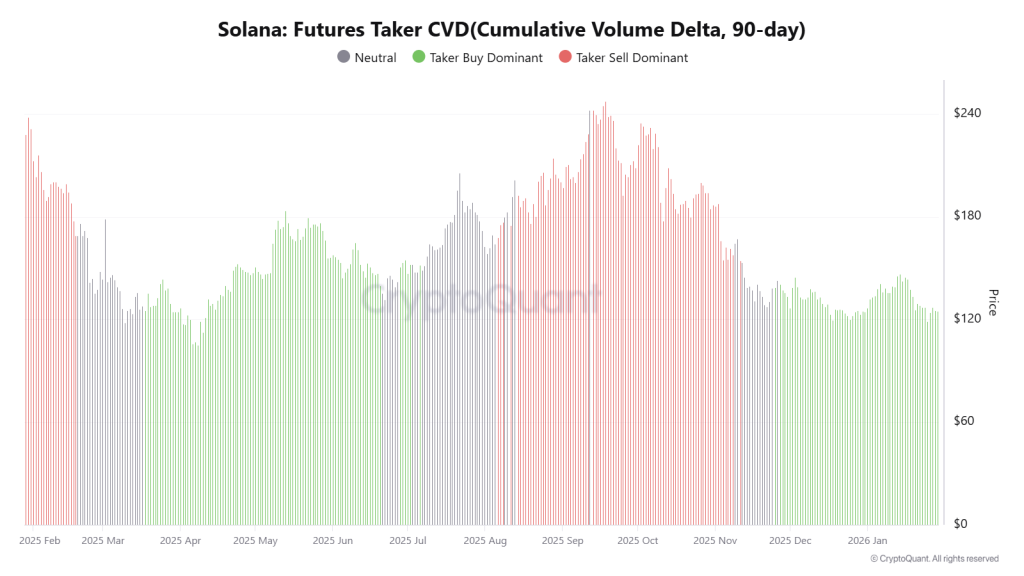
When spot and futures demand align like this near key support, the market is often coiling for a decisive move.
The Levels That Decide the Outcome
If buyers defend current levels:
First upside SOL/USD target: $135, where short-term resistance and EMA pressure converge
Breakout confirmation: $150–$180, aligned with heavy on-chain accumulation zones
If support gives way:
Immediate downside risk: $104, a prior weekly demand shelf
Deeper breakdown zone: $88–$95, the last structural base before the 2024 expansion leg
Based on the present SOL price prediction outlook it suggests, there’s little room left for sideways drift only, when this get’s passed it will choose direction.
Trust with CoinPedia:
CoinPedia has been delivering accurate and timely cryptocurrency and blockchain updates since 2017. All content is created by our expert panel of analysts and journalists, following strict Editorial Guidelines based on E-E-A-T (Experience, Expertise, Authoritativeness, Trustworthiness). Every article is fact-checked against reputable sources to ensure accuracy, transparency, and reliability. Our review policy guarantees unbiased evaluations when recommending exchanges, platforms, or tools. We strive to provide timely updates about everything crypto & blockchain, right from startups to industry majors.
Investment Disclaimer:
All opinions and insights shared represent the author's own views on current market conditions. Please do your own research before making investment decisions. Neither the writer nor the publication assumes responsibility for your financial choices.
Sponsored and Advertisements:
Sponsored content and affiliate links may appear on our site. Advertisements are marked clearly, and our editorial content remains entirely independent from our ad partners.