- Anjali Belgaumkar
 Anjali Belgaumkar
Writer by choice, CryptoCurrency Writer, and Researcher by chance. Currently, focusing on financial news and analysis, as well as cryptocurrency news and data. One may not call me a crypto “Enthusiast” but trust me I'm getting there.
- Aug 06, 2025 05:23 UTC
-
Is Altcoin Season 2025 Over? Ethereum and Bitcoin Charts Hint at Trouble Ahead

As crypto traders look for signs of a new altcoin season, recent market movements and data hint it may be too early to celebrate. While many hoped that the recent bounce in altcoins was the start of a new rally, technical signals, especially Bitcoin dominance and Ethereum ETF flows, are showing another picture.
Bitcoin Dominance Still Strong, Not Great for Altcoins
On the 3-day chart, Bitcoin dominance is still holding above a key support zone between 60.5% to 61%. This matters because when Bitcoin dominance is rising or even stable, it usually means money is staying with Bitcoin instead of moving into altcoins like Ethereum, Solana, or others.
There was a small dip in dominance recently, which helped altcoins bounce slightly, but it wasn’t enough to confirm a real altcoin rally. Until Bitcoin dominance drops clearly below this support zone, analysts say it is risky to expect big gains in altcoins.
If dominance rises from here, it could make things even harder for altcoins.
Ethereum ETFs Suffer Worst Outflow Day in History
Adding more concern for altcoins is Ethereum’s recent ETF activity. Wall Street saw massive outflows from spot Ethereum ETFs on Monday, with over $465 million pulled out in just one day. BlackRock’s Ethereum ETF alone saw $375 million in withdrawals.
This was the worst single day for Ethereum ETFs ever recorded, raising fresh concerns about short-term investor confidence and price direction.
Ethereum Faces Key Resistance and Bearish Signals
Ethereum’s price is also showing signs of weakness. It has been rejected multiple times near a major resistance zone between $3,900 and $4,100. Each time ETH touches that area, sellers take over. This has happened several times in the past year.
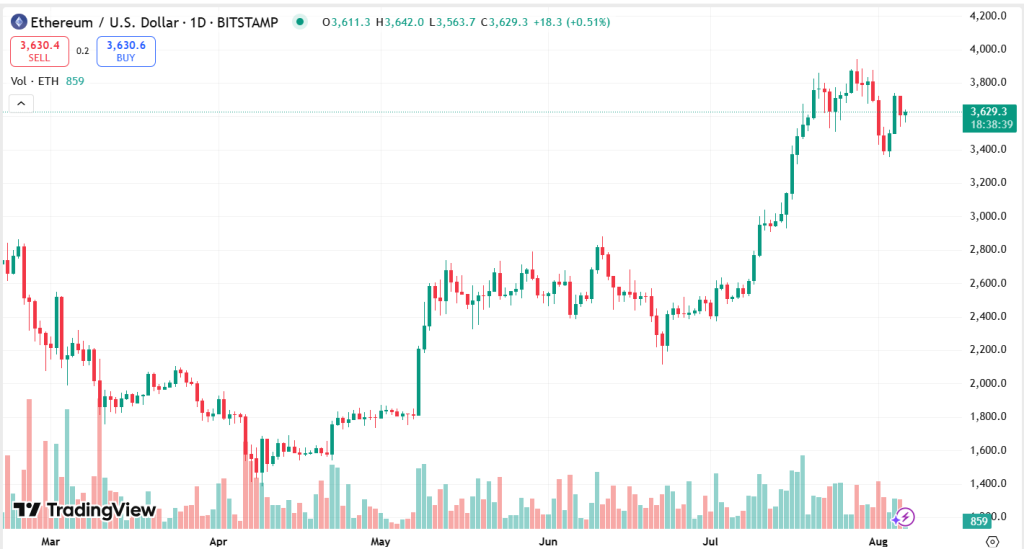
Also, a bearish divergence has appeared on Ethereum’s daily chart. This often signals a possible price drop. The last time this happened, ETH fell in the following weeks. A similar move could happen again.