- Qadir AK
 Qadir AK
Qadir Ak is the founder of Coinpedia. He has over a decade of experience writing about technology and has been covering the blockchain and cryptocurrency space since 2010. He has also interviewed a few prominent experts within the cryptocurrency space.
- Reviewed by:
 Mustafa Mulla
Mustafa has been writing about Blockchain and crypto since many years. He has previous trading experience and has been working in the Fintech industry since 2017.
- Sep 12, 2023 08:45 UTC
Stochastic Oscillator Explained: Everything A Crypto Trading Beginner Should Know
Have you ever wondered how traders predict market trends? It might seem like magic, but it’s actually a mix of experience and using the right tools. One such powerful tool is the Stochastic Oscillator. If you’re into trading or just getting started, understanding this indicator can help you make better decisions.
In this guide, we’ll break down everything you need to know about the Stochastic Oscillator in a simple, easy-to-understand way. So, let’s dive in!
What is the Stochastic Oscillator?
The Stochastic Oscillator is a momentum indicator. It helps traders understand when a stock, cryptocurrency, or any other asset is overbought or oversold.
Think of it as a speedometer for price movement. It doesn’t tell you the exact price; instead, it shows the speed and momentum of price changes. This can help traders predict potential reversals in the market.
The indicator moves between 0 and 100. Here’s what that means:
- Above 80 – The asset is considered overbought (potential sell signal).
- Below 20 – The asset is considered oversold (potential buy signal).
Traders use these levels to determine possible entry and exit points in their trades.
Formula for the Stochastic Oscillator
Now, if you’re not a fan of math, don’t worry. We’ll keep this simple.
The Stochastic Oscillator is calculated using this formula:
Where:
- Current Close = The most recent closing price.
- Lowest Low = The lowest price over a set period (usually 14 days).
- Highest High = The highest price over the same period.
There’s also a %D line, which is simply a 3-day moving average of the %K line. This helps smooth out fluctuations and provides clearer signals.
In short, %K shows momentum, and %D helps confirm it.
Example of the Stochastic Oscillator in Action
Let’s say we’re analyzing Bitcoin over a 14-day period. Here’s what the price data looks like:
- Highest price: $50,000
- Lowest price: $45,000
- Current closing price: $48,500
Plugging into our formula:
A 70% value means Bitcoin is approaching the overbought zone but isn’t quite there yet. Traders might wait for it to go above 80 before considering selling.
Now, imagine the same calculation results in a 15% value. This means Bitcoin is in oversold territory, suggesting a potential buying opportunity.
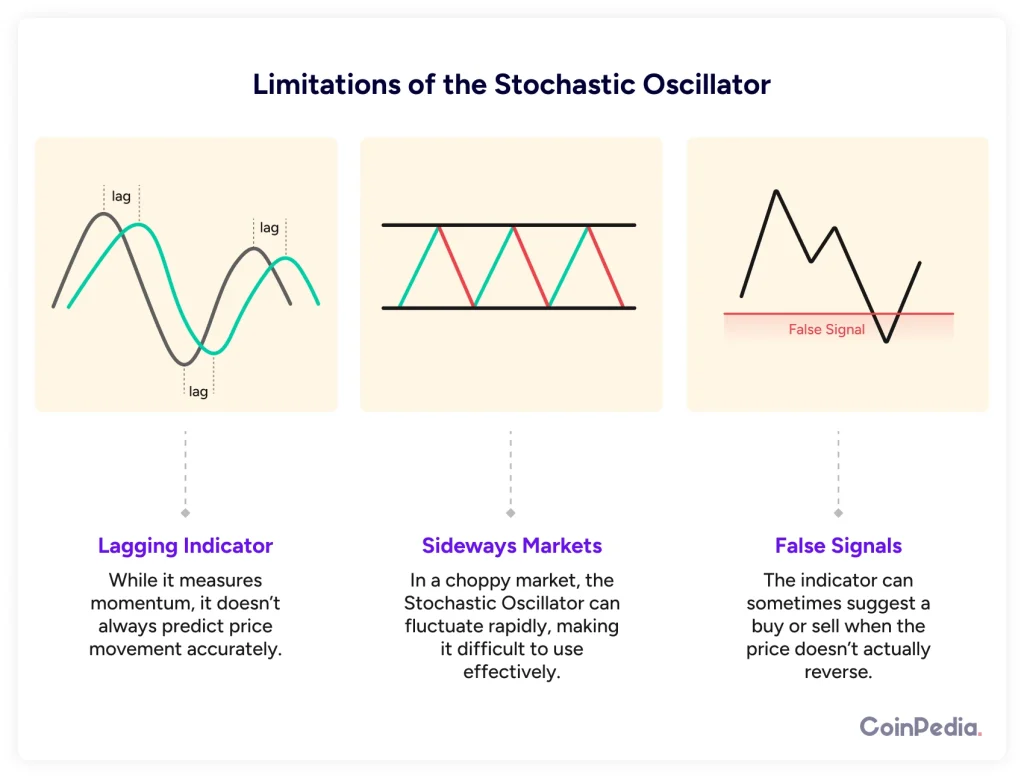
Limitations of the Stochastic Oscillator
No tool is perfect, and the Stochastic Oscillator is no exception. Here are some things to watch out for:
- False Signals – The indicator can sometimes suggest a buy or sell when the price doesn’t actually reverse. This is why traders combine it with other indicators like the Relative Strength Index (RSI) or Moving Averages.
- Sideways Markets – In a choppy market, the Stochastic Oscillator can fluctuate rapidly, making it difficult to use effectively.
- Lagging Indicator – While it measures momentum, it doesn’t always predict price movement accurately. That’s why confirmation with other tools is crucial.
Despite these drawbacks, when used correctly, the Stochastic Oscillator can be a game-changer.
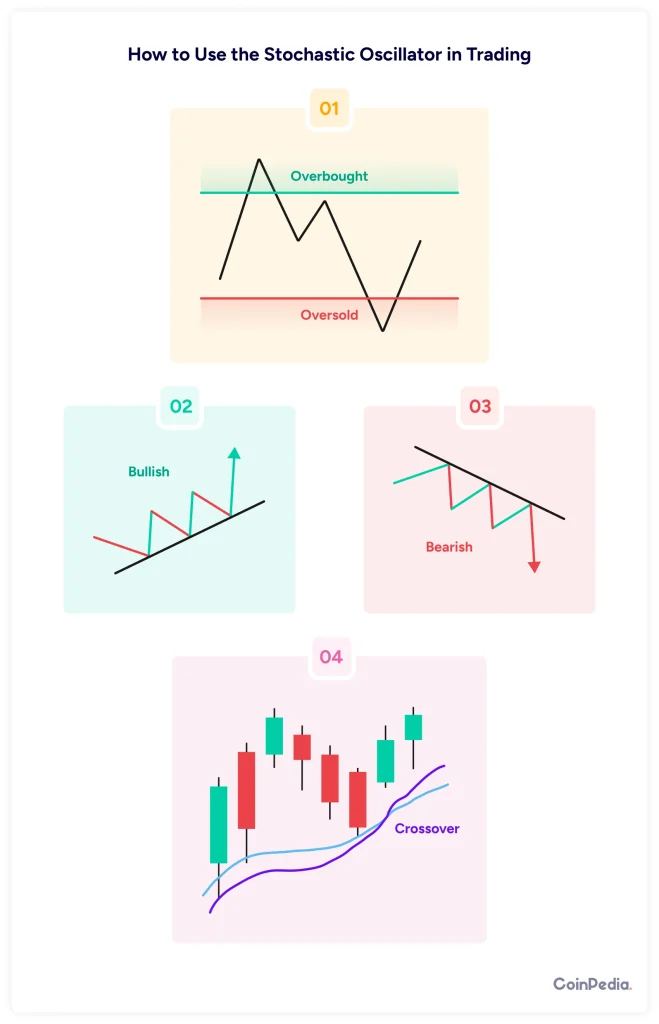
How to Use the Stochastic Oscillator in Trading?
Now comes the fun part—how to actually use this in your trades. Here are a few popular strategies:
1. Overbought & Oversold Strategy
- When %K crosses above 80, the asset is overbought. Traders may consider selling.
- When %K crosses below 20, the asset is oversold. Traders may consider buying.
Example: If Ethereum’s Stochastic Oscillator shows 85, it might be a sign to sell. If it drops to 15, it could be a good time to buy.
2. Bullish & Bearish Divergences
Divergences occur when the price moves in one direction, but the oscillator moves in the opposite direction.
- Bullish Divergence – Price makes a lower low, but the Stochastic Oscillator makes a higher low. This could mean a price increase is coming.
- Bearish Divergence – Price makes a higher high, but the oscillator makes a lower high. This could indicate a price drop.
Example: If Apple’s stock price drops but the Stochastic Oscillator rises, a reversal to the upside might happen soon.
3. The Crossover Strategy
The %K line and %D line can also give buy and sell signals:
- When %K crosses above %D, it’s a buy signal.
- When %K crosses below %D, it’s a sell signal.
Example: If the Stochastic Oscillator on Tesla stock shows %K crossing above %D at 20, it may be a good buy signal.
Also Read: What Is ADX? A Simple Guide to Trading with the Average Directional Index
Final Thoughts
The Stochastic Oscillator is a simple but powerful tool for traders. It helps identify overbought and oversold conditions, potential reversals, and market momentum.
However, no indicator should be used alone. Always combine it with other tools like moving averages, RSI, or support and resistance levels for better accuracy.
If you’re new to trading, try using the Stochastic Oscillator on a demo account first. See how it reacts in different market conditions and build confidence before making real trades.
The key to trading success? Practice, patience, and continuous learning!
The Stochastic Oscillator is a momentum indicator that helps traders identify overbought and oversold conditions in the market. It measures the closing price relative to the price range over a specific period, typically 14 days. The indicator ranges between 0 and 100, where values above 80 indicate overbought conditions (possible sell signal), and values below 20 indicate oversold conditions (possible buy signal).
The %K line is the primary line in the Stochastic Oscillator and represents the raw value of the indicator based on the formula. The %D line is a 3-day simple moving average (SMA) of the %K line, which helps smooth out fluctuations and gives clearer trading signals. Traders look for crossovers between %K and %D for buy or sell signals.
Traders commonly use the Stochastic Oscillator in three ways:
Overbought & Oversold Strategy – Buy when the oscillator drops below 20 and rises back above it; sell when it moves above 80 and drops below it.
Divergences – A bullish divergence (price makes lower lows, but the oscillator makes higher lows) can signal a potential upward reversal. A bearish divergence suggests a downtrend.
Crossover Strategy – When %K crosses above %D, it signals a potential buy. When %K crosses below %D, it signals a possible sell.
Yes, the Stochastic Oscillator can sometimes generate false buy or sell signals, especially in sideways (range-bound) markets. This happens because the indicator reacts quickly to price changes. To minimize false signals, traders often use it in combination with other indicators like the Relative Strength Index (RSI), Moving Averages, or support and resistance levels.
The Stochastic Oscillator is more commonly used in short-term and medium-term trading, such as day trading and swing trading, because it reacts quickly to price movements. However, long-term traders can also use it on higher timeframes (e.g., weekly charts) to identify broader market trends and potential reversals. The settings can be adjusted to suit different trading styles.
We'd Love to Hear Your Thoughts on This Article!
Was this writing helpful?
 Yes No
Trust with CoinPedia:
CoinPedia has been delivering accurate and timely cryptocurrency and blockchain updates since 2017. All content is created by our expert panel of analysts and journalists, following strict Editorial Guidelines based on E-E-A-T (Experience, Expertise, Authoritativeness, Trustworthiness). Every article is fact-checked against reputable sources to ensure accuracy, transparency, and reliability. Our review policy guarantees unbiased evaluations when recommending exchanges, platforms, or tools. We strive to provide timely updates about everything crypto & blockchain, right from startups to industry majors.
Investment Disclaimer:
All opinions and insights shared represent the author's own views on current market conditions. Please do your own research before making investment decisions. Neither the writer nor the publication assumes responsibility for your financial choices.
Sponsored and Advertisements:
Sponsored content and affiliate links may appear on our site. Advertisements are marked clearly, and our editorial content remains entirely independent from our ad partners.


