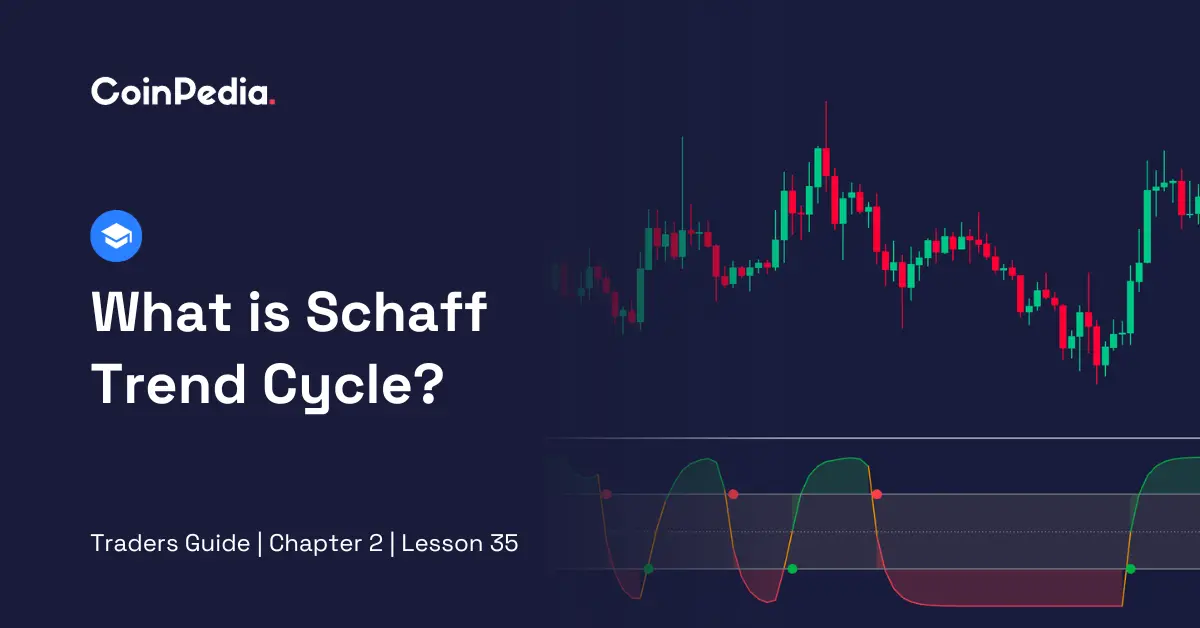
MACD is a highly popular indicator among crypto traders. Its popularity stems from its simplicity and ability to provide quality trading signals. For MACD enthusiasts, there is some good news – there is an indicator that can be considered an improved version of the MACD, known as the Schaff Trend Cycle. Let’s delve deeper into this indicator.
1. What’s Schaff Trend Cycle
The Schaff Trend Cycle is an oscillator-type indicator. It can help crypto traders identify positive or negative trends, pinpoint entry and exit points, and generate buy and sell signals. It was developed by Dough Schaff as an enhancement to traditional moving averages, incorporating cycle analysis to provide more precise insights into market trends.
2. Similarities and Dissimilarities Between STC and MACD
| Similarities B/W STC and MACD | Dissimilarities B/W STC and MACD |
Calculation MethodBoth use Moving AveragesTrend IdentificationBoth capture price trendsOscillating IndicatorValues oscillate around a centerlineSignal Line Both have a signal line for trading signalsCrossover SignalsBoth use crossovers for buy/sell signals | MACD STCCalculation MethodMACD uses EMA difference STC combines EMAs with cycle analysisSignal Line CalculationMACD always uses a 9-period EMA for signalSTC does not always require itOverbought/Oversold Levels MACD based on zeroSTC has levels at 75 and 25Focus on Trend CyclesMACD is broaderSTC emphasises trend cyclesInterpretation & ApplicationMACD versatileSTC suitable for trending markets |
3. Calculating Schaff Trend Cycle
Calculating STC is a bit complex.
| STC = ( (EMA1 + (Factor * EMA2) ) + (Factor * EMA3) ) / (1 + Factor) |
So let’s break down the calculation to six steps.
- Step 1: Calculate the 10-period EMA for the close price, which is EMA1
- Step 2: Calculate the 23.5-period EMA for EMA1 and multiply it by a factor, which is determined by the cycle period you want to use. This becomes part of EMA2
- Step 3: Calculate the 50.5-period EMA of EMA1 and multiply it by the same factor, resulting in EMA3
- Step 4: Sum EMA1, the factor multiplied by EMA2, and the factor multiplied by EMA3
- Step 5: Add 1 to the factor
- Step 6: Divide the result from step 4 by the result from step 5 to obtain the Schaff Trend Cycle (STC) value
4. Launching Schaff Trend Cycle on a TradingView Chart
Let’s learn how to launch the Schaff Trend Cycle indicator on a TradingView chart.
- Log in to TradingView
- Open the trading pair or asset chart you want to analyse
- Click on the ‘indicators’ button at the top of the chart
- In the search bar, type ‘Schaff Trend Cycle’ or ‘STC’
- Select ‘Schaff Trend Cycle’ from the results
- Adjust your preferred parameters if needed using its settings option
- Click ‘OK’
- The STC indicator will now appear on your chart
- Start your analysis using the STC to identify trends and make trading decisions.
5. How to Interpret Schaff Trend Cycle Signals
Here are the basic signals the Schaff Trend Cycle indicator can give:
- Overbought/Oversold
Value above 75 suggests overbought conditions, while values below 25 indicate oversold conditions on the 0 to 100 scale.
- Trend Confirmation
Use STC to confirm the direction of the trend. When STC is rising, it suggests an uptrend, and when falling, it indicates a downtrend.
Also Read: Polarized Fractal Efficiency: Simple Tool To Be A Successful Crypto Trader
Endnote
The Schaff Trend Cycle is a valuable tool for crypto traders, aiding in trend identification, signal generation, and enhanced precision through cycle analysis. When compared to the MACD, it shares several commonalities while distinguishing itself in terms of its calculation method and focus on trend cycles. Calculating STC and launching it on TradingView are simple, yet complicated. Interpreting STC signals involves recognising overbought/oversold conditions, and confirming trend directions, empowering traders to make informed decisions in the volatile world of cryptocurrency trading.
We'd Love to Hear Your Thoughts on This Article!
Was this writing helpful?
 Yes
Yes  No
No
Trust with CoinPedia:
CoinPedia has been delivering accurate and timely cryptocurrency and blockchain updates since 2017. All content is created by our expert panel of analysts and journalists, following strict Editorial Guidelines based on E-E-A-T (Experience, Expertise, Authoritativeness, Trustworthiness). Every article is fact-checked against reputable sources to ensure accuracy, transparency, and reliability. Our review policy guarantees unbiased evaluations when recommending exchanges, platforms, or tools. We strive to provide timely updates about everything crypto & blockchain, right from startups to industry majors.
Investment Disclaimer:
All opinions and insights shared represent the author's own views on current market conditions. Please do your own research before making investment decisions. Neither the writer nor the publication assumes responsibility for your financial choices.
Sponsored and Advertisements:
Sponsored content and affiliate links may appear on our site. Advertisements are marked clearly, and our editorial content remains entirely independent from our ad partners.


