- Qadir AK
 Qadir AK
Qadir Ak is the founder of Coinpedia. He has over a decade of experience writing about technology and has been covering the blockchain and cryptocurrency space since 2010. He has also interviewed a few prominent experts within the cryptocurrency space.
- Reviewed by:
 Mustafa Mulla
Mustafa has been writing about Blockchain and crypto since many years. He has previous trading experience and has been working in the Fintech industry since 2017.
- Sep 12, 2023 08:39 UTC
Relative Strength Index (RSI)

Think you’re driving a car. You keep accelerating without slowing down. Eventually, the engine overheats, and you’re forced to stop. The stock market works in a similar way. When prices move too fast in one direction, they tend to pull back. That’s where the Relative Strength Index (RSI) comes in. It tells you if an asset is overbought (moving too fast up) or oversold (moving too fast down). If you’re trading without looking at RSI, you might be driving blind!
Now, let’s break it down step by step.
What is Relative Strength Index (RSI)?
RSI is a momentum indicator that helps traders understand whether an asset is overbought or oversold. Developed by J. Welles Wilder in 1978, it measures the speed and change of price movements on a scale of 0 to 100.
- Overbought: RSI above 70 – The asset may be overpriced and due for a correction.
- Oversold: RSI below 30 – The asset may be undervalued and due for a bounce.
It’s a simple yet powerful tool that helps traders make better decisions.
How the Relative Strength Index (RSI) Works
RSI calculates the average gains and losses over a set period, usually 14 days. It then plots this on a scale of 0 to 100. The formula looks like this:
Where RS (Relative Strength) = Average Gain / Average Loss.
But don’t worry—you don’t have to do the math yourself. Trading platforms like TradingView or Binance will calculate it for you. Your job is to interpret what RSI is telling you.
Let’s say Bitcoin has been rising for 10 straight days. The RSI might be above 70, indicating that the price is overheated and due for a pullback. On the other hand, if Bitcoin crashes for 10 days straight, RSI could fall below 30, suggesting a potential rebound.
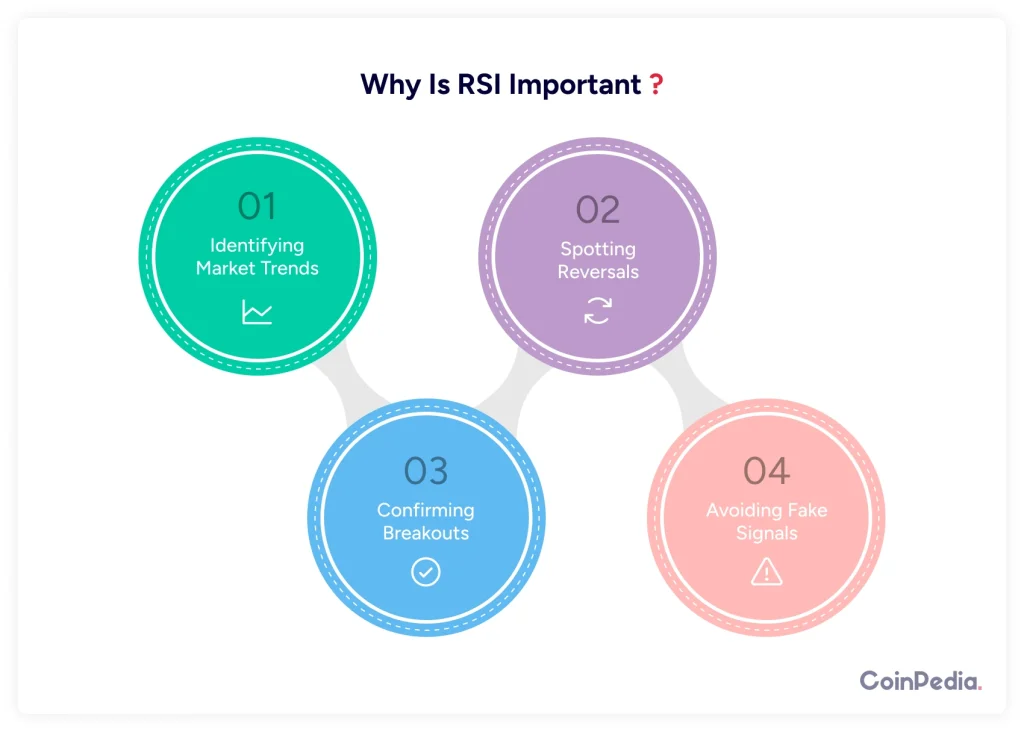
Why Is RSI Important?
- Identifying Market Trends: RSI helps you see if an asset is trending up or down. If RSI stays above 50, the trend is likely bullish. If it stays below 50, it’s bearish.
- Spotting Reversals: When RSI enters overbought or oversold territory, it hints at a potential price reversal.
- Confirming Breakouts: Let’s say Bitcoin is breaking out of a resistance level. If RSI is also rising, it confirms that the breakout is strong.
- Avoiding Fake Signals: Sometimes, prices move irrationally. RSI acts as a filter to confirm whether a move is real or just noise.
What Is a Good RSI Number to Use?
The default RSI setting is 14 periods, meaning it looks at the last 14 candles on a chart. But you can adjust it:
- Short-term traders (scalping, day trading) prefer RSI 7 or 9 for faster signals.
- Swing traders use RSI 14 as it balances accuracy and speed.
- Long-term traders may use RSI 21 or higher for a smoother trend analysis.
There’s no single “perfect” RSI number. It depends on your trading style.
How to Use RSI in Your Trading Strategy
1. The Overbought & Oversold Strategy
If RSI is above 70, the asset is overbought. If RSI is below 30, the asset is oversold.
- Example: Bitcoin’s RSI hits 80 after a rapid surge. A trader might sell, expecting a pullback.
- Example: Ethereum’s RSI drops to 25 after a big crash. A trader might buy, expecting a bounce.
2. RSI Divergence Strategy
This is one of the most powerful RSI strategies. It happens when price and RSI move in opposite directions.
- Bullish Divergence: Price makes a lower low, but RSI makes a higher low. This suggests momentum is picking up, and price might reverse upwards.
- Bearish Divergence: Price makes a higher high, but RSI makes a lower high. This signals weakness and a potential downtrend.
Example: Bitcoin hits a new all-time high, but RSI forms a lower high. This could be a warning sign of a coming drop.
3. RSI and Moving Averages
RSI works even better when combined with moving averages.
- If RSI is oversold and price is near the 200-day moving average, it could be a strong buy signal.
- If RSI is overbought and price is far above moving averages, it might be time to take profits.
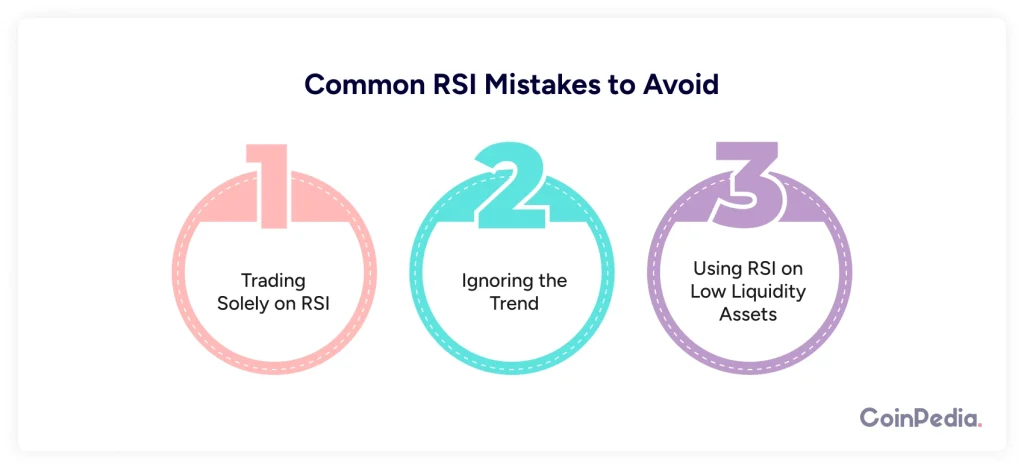
Common RSI Mistakes to Avoid
- Trading Solely on RSI: RSI is great, but it’s not perfect. Always combine it with other indicators like volume, trend lines, and moving averages.
- Ignoring the Trend: In a strong uptrend, RSI can stay overbought for a long time. Just because RSI is above 70 doesn’t mean the price will crash immediately.
- Using RSI on Low Liquidity Assets: RSI works best on high-volume assets like Bitcoin, Ethereum, or major stocks. On low-volume coins, RSI can give misleading signals.
Final Thoughts: RSI as Your Trading Compass
RSI is like a compass for traders. It won’t tell you exactly where the market is going, but it helps you navigate price movements better. By understanding overbought and oversold levels, spotting divergences, and combining RSI with other tools, you can make smarter trading decisions.
Remember, no indicator is foolproof. RSI is just one piece of the puzzle. But when used correctly, it can be a game-changer.
FAQs
Yes, RSI can be used for stocks, forex, crypto, commodities, and even indices. However, its effectiveness varies depending on the asset’s volatility and trading volume. Highly volatile assets may require adjusting RSI settings for better accuracy.
If RSI remains above 70 or below 30 for an extended period, it could indicate a strong trend rather than an immediate reversal. In strong uptrends, RSI can stay overbought for a long time, and in strong downtrends, it can remain oversold. This is why traders should not rely on RSI alone but use it alongside trend analysis.
Yes! Many scalpers and day traders use RSI with lower timeframes (e.g., RSI 5 or 7) to get quicker signals. However, shorter time frames tend to be more sensitive and may produce more false signals, so traders should confirm signals with other indicators.
RSI can be used for both. A trader can enter a position when RSI signals an oversold condition and exit when RSI signals overbought. However, RSI works best when combined with support/resistance levels and other technical indicators to improve timing.
A failure swing is a strong signal that confirms a trend reversal. It happens when RSI moves into overbought/oversold territory, attempts to return to neutral but fails, and then reverses strongly in the opposite direction. A bullish failure swing occurs when RSI fails to drop below a previous low before reversing up, while a bearish failure swing happens when RSI fails to break a previous high before falling. This strategy helps confirm trend reversals with more confidence.
We'd Love to Hear Your Thoughts on This Article!
Was this writing helpful?
 Yes No
Trust with CoinPedia:
CoinPedia has been delivering accurate and timely cryptocurrency and blockchain updates since 2017. All content is created by our expert panel of analysts and journalists, following strict Editorial Guidelines based on E-E-A-T (Experience, Expertise, Authoritativeness, Trustworthiness). Every article is fact-checked against reputable sources to ensure accuracy, transparency, and reliability. Our review policy guarantees unbiased evaluations when recommending exchanges, platforms, or tools. We strive to provide timely updates about everything crypto & blockchain, right from startups to industry majors.
Investment Disclaimer:
All opinions and insights shared represent the author's own views on current market conditions. Please do your own research before making investment decisions. Neither the writer nor the publication assumes responsibility for your financial choices.
Sponsored and Advertisements:
Sponsored content and affiliate links may appear on our site. Advertisements are marked clearly, and our editorial content remains entirely independent from our ad partners.


