- Qadir AK
 Qadir AK
Qadir Ak is the founder of Coinpedia. He has over a decade of experience writing about technology and has been covering the blockchain and cryptocurrency space since 2010. He has also interviewed a few prominent experts within the cryptocurrency space.
- Reviewed by:
 Mustafa Mulla
Mustafa has been writing about Blockchain and crypto since many years. He has previous trading experience and has been working in the Fintech industry since 2017.
- Sep 12, 2023 07:58 UTC
Everything About Moving Averages: A Simple Guide For Crypto Beginners
Have you ever looked at a price chart and felt completely lost? Candles going up and down, patterns forming and breaking, and you’re left wondering—what’s really happening? If that sounds familiar, you’re not alone.
Here’s the truth: the market is always talking. It leaves clues in the form of price action. But to truly understand these clues, you need the right tools. One of the simplest yet most powerful tools is Moving Averages.
Moving Averages (MAs) help traders make sense of the chaos. They smooth out price fluctuations and give you a clearer picture of trends. Think of them as a filter that removes the noise so you can see the real movement of the market.
So, let’s break it down. By the end of this guide, you’ll know exactly how to use moving averages to read price action like a pro.
What Are Moving Averages?
Moving Averages are indicators that show the average price over a specific period. The two main types are:
- Simple Moving Average (SMA) – A straightforward average of closing prices over a set number of days.
- Exponential Moving Average (EMA) – Puts more weight on recent prices, making it more responsive.
For example, if you’re using a 50-day SMA, it calculates the average closing price over the last 50 days. Each new day, it drops the oldest price and adds the latest one.
The 50-day and 200-day MAs are widely used by traders to identify trends. Shorter-term MAs like the 9-day and 21-day work well for faster movements.
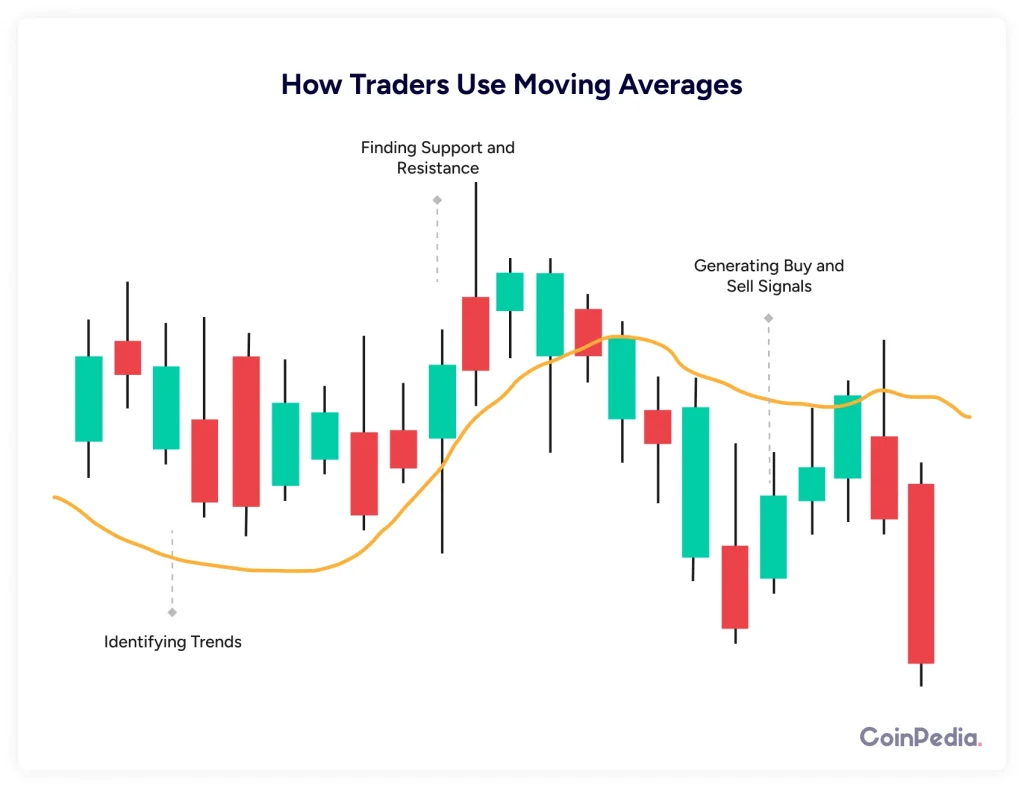
How Moving Averages Reveal Trends
1. Identifying the Trend
Moving Averages help you see the overall trend at a glance:
- Price above the MA → Uptrend
- Price below the MA → Downtrend
- Price hovering around the MA → Sideways (no clear trend)
For example, if Bitcoin is trading above its 50-day MA, the trend is bullish (upward). If it falls below, the trend may be turning bearish.
2. Crossovers: A Powerful Signal
Crossovers happen when a shorter-term MA crosses a longer-term MA. This signals a possible trend change.
- Golden Cross (bullish) – When a short MA (e.g., 50-day) crosses above a long MA (e.g., 200-day).
- Death Cross (bearish) – When a short MA crosses below a long MA.
Example: In 2020, Bitcoin had a Golden Cross where the 50-day MA crossed above the 200-day MA. This was followed by a strong uptrend.
Using Moving Averages with Price Action
Price action is the raw movement of price on a chart. By combining it with moving averages, we can get high-probability trading signals.
1. Support and Resistance
Moving Averages act as dynamic support and resistance levels.
- In an uptrend, price often pulls back to the MA before bouncing higher.
- In a downtrend, price rallies to the MA but struggles to break above it.
Example: If Ethereum is in an uptrend and pulls back to the 50-day MA, that level may act as support, and the price could bounce higher.
2. Trend Strength
- If price stays far above an MA, the trend is strong.
- If price keeps touching the MA, the trend is weak or reversing.
For example, if the price of Tesla stock is consistently above the 200-day MA without touching it, the trend is strong.
Trading Strategies Using Moving Averages
1. Trend-Following Strategy
This is for traders who want to ride the trend until it ends.
- Buy when price is above a rising MA.
- Sell when price is below a falling MA.
For example, if Apple’s stock price is above the 50-day MA, you could stay long until the price closes below it.
2. Moving Average Bounce
This works best in trending markets where price respects the MA.
- Enter when price touches the MA and bounces.
- Set a stop-loss below the MA (for buys) or above the MA (for sells).
Example: If gold is trending up and pulls back to the 200-day MA, a trader may enter a buy trade if it starts to bounce off that level.
3. Moving Average Crossover Strategy
- Buy when a short MA crosses above a long MA (Golden Cross).
- Sell when a short MA crosses below a long MA (Death Cross).
Example: If Bitcoin’s 50-day MA crosses above the 200-day MA, traders might look for buying opportunities.
Common Mistakes to Avoid
- Ignoring the Bigger Picture – Moving averages work best when combined with other indicators like volume or RSI.
- Trading Every Crossover – Not every crossover is a strong signal. Look for confirmation from price action.
- Overloading with Too Many MAs – Stick to a few key ones like the 50-day and 200-day. Too many lines create confusion.
Final Thoughts
Reading price action with moving averages is like learning a new language. At first, it may seem tricky, but with practice, it becomes second nature.
Keep it simple. Look for trends, use MAs as dynamic support/resistance, and don’t rush into every signal. The market always gives opportunities—your job is to read them right.
FAQs
For day trading, shorter-term moving averages like the 9-day EMA and 21-day EMA work best because they respond quickly to price changes, helping traders catch short-term trends.
Yes! Moving averages work well in crypto, but since crypto markets are more volatile, using a combination of EMAs (like 10-day and 50-day EMAs) can help smooth out price action and provide better entry points.
It depends on your trading style:
Scalpers: Use 1-minute to 5-minute charts.
Day traders: Use 15-minute to 1-hour charts.
Swing traders: Use 4-hour to daily charts.
False signals are common, especially in choppy markets. To filter them out, use additional indicators like RSI or MACD, and always confirm with price action before making a trade.
Not really. When the market is ranging (sideways), moving averages can generate a lot of false signals. It’s better to rely on support and resistance levels or momentum indicators in such conditions.
We'd Love to Hear Your Thoughts on This Article!
Was this writing helpful?
 Yes No
Trust with CoinPedia:
CoinPedia has been delivering accurate and timely cryptocurrency and blockchain updates since 2017. All content is created by our expert panel of analysts and journalists, following strict Editorial Guidelines based on E-E-A-T (Experience, Expertise, Authoritativeness, Trustworthiness). Every article is fact-checked against reputable sources to ensure accuracy, transparency, and reliability. Our review policy guarantees unbiased evaluations when recommending exchanges, platforms, or tools. We strive to provide timely updates about everything crypto & blockchain, right from startups to industry majors.
Investment Disclaimer:
All opinions and insights shared represent the author's own views on current market conditions. Please do your own research before making investment decisions. Neither the writer nor the publication assumes responsibility for your financial choices.
Sponsored and Advertisements:
Sponsored content and affiliate links may appear on our site. Advertisements are marked clearly, and our editorial content remains entirely independent from our ad partners.


