- Qadir AK
 Qadir AK
Qadir Ak is the founder of Coinpedia. He has over a decade of experience writing about technology and has been covering the blockchain and cryptocurrency space since 2010. He has also interviewed a few prominent experts within the cryptocurrency space.
- Reviewed by:
 Mustafa Mulla
Mustafa has been writing about Blockchain and crypto since many years. He has previous trading experience and has been working in the Fintech industry since 2017.
- Mar 27, 2025 04:31 UTC
What Is CCI? How to Use the Commodity Channel Index for Better Trades

Think you’re in the market, trying to figure out if it’s the right time to buy or sell. You’ve checked the news, looked at the charts, but you still feel like you need an extra tool to confirm your decision. That’s where the Commodity Channel Index (CCI) comes in.
The CCI is one of the most popular indicators among traders. It helps in identifying trends, spotting reversals, and finding entry and exit points. But like any tool, it has its strengths and weaknesses. In this guide, we’ll break down what the CCI is, how you can use it, and the mistakes to avoid when relying on it.
What Is the Commodity Channel Index (CCI)?
The Commodity Channel Index (CCI) is a momentum-based technical indicator. It was developed by Donald Lambert in 1980, and despite its name, it can be used for any asset—not just commodities.
So, what does it do? In simple terms, the CCI measures how far the current price of an asset is from its average price over a given period. This helps traders determine whether an asset is overbought or oversold—basically, whether the price is too high or too low compared to its recent average.
Here’s the formula used to calculate the CCI:
Now, if you’re not a math geek, don’t worry. You don’t need to calculate it manually—trading platforms do it for you. What you need to understand is how to read and apply it in real-world trading.
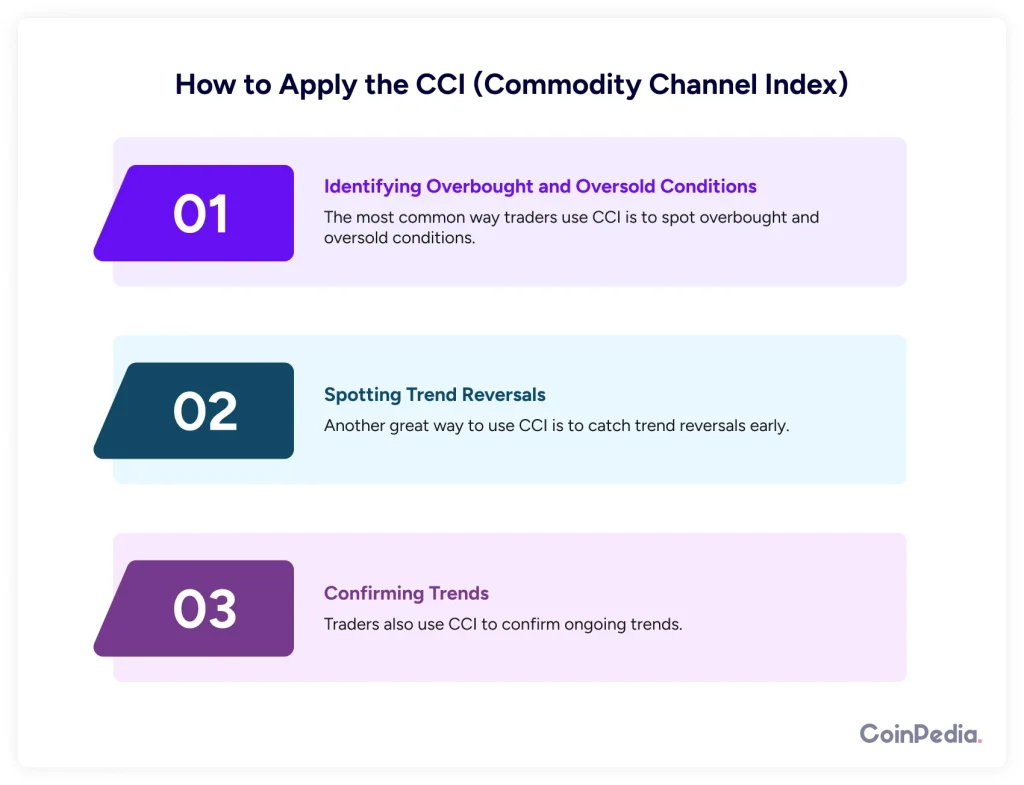
How to Apply the CCI?
1. Identifying Overbought and Oversold Conditions
The most common way traders use CCI is to spot overbought and oversold conditions.
- When the CCI value is above +100, it suggests the asset is overbought. This could mean the price has gone up too much, too fast, and a reversal might be coming.
- When the CCI value is below -100, it suggests the asset is oversold. This might indicate a potential buying opportunity as the price could bounce back.
2. Spotting Trend Reversals
Another great way to use CCI is to catch trend reversals early. If the CCI moves from negative to positive, it may signal the start of an uptrend. On the other hand, if it drops from positive to negative, it might be a warning that a downtrend is beginning.
3. Confirming Trends
Traders also use CCI to confirm ongoing trends. If the CCI stays above +100 for an extended period, it confirms that the asset is in a strong uptrend. If it remains below -100, the downtrend is likely strong.
Example:
Let’s say you’re looking at Bitcoin, and the CCI has been rising steadily above +100. This confirms the strong uptrend, and you may decide to hold your position longer. But if it suddenly drops below -100, you might consider exiting before a bigger sell-off happens.
Don’t Rely Solely on CCI
No trading indicator is perfect, and the CCI is no exception. It’s useful, but it has limitations. Let’s talk about some common pitfalls:
1. False Signals
CCI can sometimes generate false signals, especially in sideways markets. Just because CCI crosses +100 doesn’t mean the price will immediately drop, and just because it crosses -100 doesn’t mean the price will shoot up.
Solution: Combine CCI with other indicators like moving averages or RSI to filter out false signals.
2. Market Conditions Matter
The effectiveness of CCI depends on the market conditions. It works well in trending markets but not as well in choppy or sideways markets.
Solution: Always check the broader market trend before acting on a CCI signal.
3. No One-Size-Fits-All Settings
The standard period for CCI is 14, but this doesn’t always work for every asset or time frame. Shorter periods (e.g., 7) make CCI more sensitive but can generate more false signals. Longer periods (e.g., 30) smooth out the noise but may lag behind price movements.
Solution: Experiment with different settings based on the asset and time frame you are trading.
How Do You Use the Commodity Channel Index (CCI)?
1. Using CCI in a Trading Strategy
Let’s look at two common strategies using CCI.
A. CCI + Moving Average Crossover
- Use a 50-period moving average to determine the overall trend.
- Only take buy signals from CCI when the price is above the moving average.
- Only take sell signals when the price is below the moving average.
This helps filter out false signals and improves accuracy.
B. CCI Divergence Strategy
- If the price is making higher highs but CCI is making lower highs, this is bearish divergence, signaling a potential trend reversal downward.
- If the price is making lower lows but CCI is making higher lows, this is bullish divergence, suggesting a possible trend reversal upward.
2. Best Time frames for CCI
- Day traders: Use shorter periods (5-10) for quick signals.
- Swing traders: Stick with the default 14-period setting.
- Long-term traders: Use 30+ periods for a smoother trend analysis.
3. Example Trade Using CCI
Imagine you’re trading Ethereum, and you see:
- CCI crosses above +100 – this indicates strong bullish momentum.
- The price is also above the 50-period moving average – confirming an uptrend.
- You decide to enter a buy trade.
- A few days later, CCI drops below +100 – signaling a weakening trend.
- You exit the trade with a profit before a major drop happens.
This is how traders use CCI effectively, combining signals and market conditions to make informed decisions.
Conclusion
The Commodity Channel Index (CCI) is a powerful tool, but like any indicator, it should never be used in isolation. It helps traders identify overbought and oversold conditions, spot trend reversals, and confirm trends. However, false signals can occur, and it’s essential to use additional tools like moving averages or RSI for confirmation.
If you’re new to trading, start by experimenting with CCI on a demo account. Try different settings, combine it with other indicators, and see what works best for your strategy. Over time, you’ll learn how to use it effectively to improve your trading decisions.
So, the next time you’re analyzing a chart, check the CCI and see what it’s telling you. It might just give you that extra edge you need!
Also read: Crypto Trading Mindset: How to Stay Disciplined & Make Consistent Profits
FAQs
The CCI is a momentum indicator that measures how far an asset’s price deviates from its average, helping traders spot overbought or oversold conditions.
Traders look for CCI crossing above +100 (bullish) or below -100 (bearish) to spot potential reversals, confirming signals with other indicators like RSI.
Day traders often use a shorter period (5-10) for quick signals, while swing traders prefer the default 14-period setting for more reliable trends.
CCI can produce false signals in sideways markets. It works best in trending conditions and should be combined with moving averages or RSI for accuracy.
If the price hits higher highs but CCI forms lower highs (bearish divergence), a downtrend may follow. The opposite (bullish divergence) suggests an uptrend.
We'd Love to Hear Your Thoughts on This Article!
Was this writing helpful?
 Yes No
Trust with CoinPedia:
CoinPedia has been delivering accurate and timely cryptocurrency and blockchain updates since 2017. All content is created by our expert panel of analysts and journalists, following strict Editorial Guidelines based on E-E-A-T (Experience, Expertise, Authoritativeness, Trustworthiness). Every article is fact-checked against reputable sources to ensure accuracy, transparency, and reliability. Our review policy guarantees unbiased evaluations when recommending exchanges, platforms, or tools. We strive to provide timely updates about everything crypto & blockchain, right from startups to industry majors.
Investment Disclaimer:
All opinions and insights shared represent the author's own views on current market conditions. Please do your own research before making investment decisions. Neither the writer nor the publication assumes responsibility for your financial choices.
Sponsored and Advertisements:
Sponsored content and affiliate links may appear on our site. Advertisements are marked clearly, and our editorial content remains entirely independent from our ad partners.


