- Qadir AK
 Qadir AK
Qadir Ak is the founder of Coinpedia. He has over a decade of experience writing about technology and has been covering the blockchain and cryptocurrency space since 2010. He has also interviewed a few prominent experts within the cryptocurrency space.
- Dec 31, 2023 07:39 UTC
Volume Price Action Trading Demystified: Crypto Trading Made Simple
Imagine walking into a party. You see two groups of people chatting. One group has three people, speaking softly. The other has twenty people, laughing loudly. Which group is more interesting? Probably the one with more people, right?
The same logic applies to the stock market. Price moves happen all the time, but without volume, they don’t mean much. Volume tells us how many traders are involved in a move. It’s the fuel behind price action. Without volume, price movements are like empty promises.
So, let’s break it down. What exactly is volume? And how can we use it to make smarter trading decisions?
Understanding Volume in Trading
Volume is the number of shares or contracts traded in a given period. If a stock has a high volume, it means many traders are buying and selling it. If volume is low, fewer people are interested.
Think of it like this:
- High volume = high interest = stronger moves
- Low volume = low interest = weak moves (or fakeouts)
For traders, volume is a crucial tool. It helps confirm trends, detect reversals, and spot breakouts. If you’re trading without looking at volume, you’re missing half the picture.
Volume and Price Action – A Powerful Combination
Many traders focus only on price action. They look at candlesticks, patterns, and trends. But without volume, it’s like driving with one eye closed.
Let’s say a stock breaks above resistance. You might think, “This is a breakout! Time to buy.” But wait—what if the volume is low? That breakout could be weak and fail. Now imagine the same breakout but with high volume. That’s a strong sign that buyers are serious.
Volume tells you the truth behind price movements.
How to Use Volume in Trading
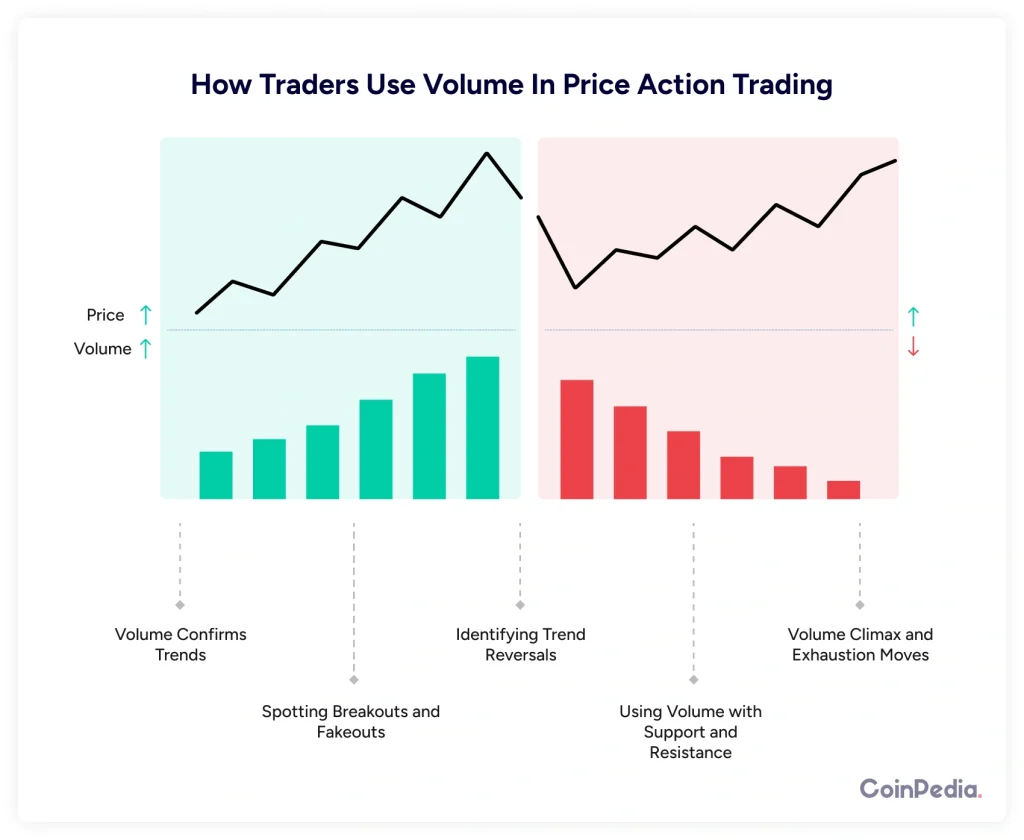
Now, let’s dive into how traders use volume in price action trading.
1. Volume Confirms Trends
A strong uptrend should have rising volume. If the price is climbing, but volume is low, be cautious. It means fewer traders are buying, and the trend might not last.
Example:
- A stock moves from $50 to $55 with high volume. This suggests strong buying interest.
- If it moves from $50 to $55 with low volume, the move is weak and might reverse.
A downtrend works the same way. If prices are falling on high volume, sellers are in control. If volume is low, the trend might be losing strength.
2. Spotting Breakouts and Fakeouts
Breakouts happen when price moves beyond a key level (like resistance or support). But not all breakouts are real.
Real Breakout = High Volume Fakeout = Low Volume
Example:
- A stock breaks above $100 resistance with high volume. This means buyers are committed, and the breakout is likely real.
- If it breaks $100 on low volume, there’s no real interest. It could be a trap.
3. Identifying Trend Reversals
Volume spikes often signal a change in trend. If a stock has been rising for weeks but suddenly has a massive volume spike and stalls, it could mean sellers are stepping in.
Example:
- A stock moves from $80 to $100 with steady volume.
- Suddenly, there’s a huge volume spike, but the price stops climbing.
- This could mean buyers are exhausted, and a reversal is near.
The same applies to downtrends. If a stock has been falling, but volume spikes on a bounce, it could signal a bottom.
Also Read: Crypto Trading Wisdom: Why Price Action Traders Use Moving Averages
4. Using Volume with Support and Resistance
Volume can also help confirm support and resistance levels. If a stock bounces off support with high volume, that level is strong. If it breaks support with high volume, the downtrend will likely continue.
Example:
- A stock tests $50 support three times with rising volume each time. This suggests strong buying interest at that level.
- If it finally breaks below $50 with massive volume, it signals sellers have taken control.
5. Volume Climax and Exhaustion Moves
Sometimes, a huge volume spike can signal the end of a move rather than the beginning. This is known as a volume climax.
Example:
- A stock surges from $30 to $50 in a week.
- On the last day, volume is 10x higher than usual, and the price barely moves.
- This could mean buyers are exhausted, and a pullback is coming.
This happens in downtrends, too. If a stock crashes on massive volume but stops falling, it could mean sellers are done, and a reversal is near.
Tools to Track Volume
Most trading platforms include volume indicators. Here are a few popular ones:
1. Basic Volume Bars
These are the simple bars you see at the bottom of a chart. They show volume for each time period.
2. Volume Moving Average
This smooths out volume to help spot trends. If volume is rising over time, it signals growing interest.
3. Volume Weighted Average Price (VWAP)
VWAP helps traders see the average price based on volume. It’s often used to gauge fair value.
4. On-Balance Volume (OBV)
OBV adds volume on up days and subtracts it on down days. If OBV is rising while price is flat, it suggests hidden buying.
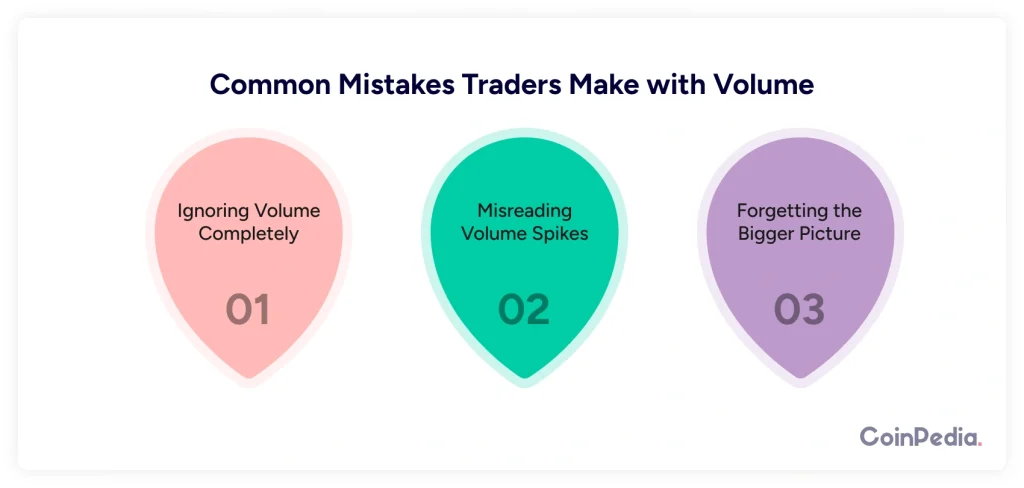
Common Mistakes Traders Make with Volume
- Ignoring Volume Completely Many traders focus only on price and forget about volume. Big mistake. Always check volume before making a trade.
- Misreading Volume Spikes Not every volume spike means a trend is changing. Look at the context. If a stock jumps on high volume but no real news, it could be a trap.
- Forgetting the Bigger Picture Volume works best with other signals. Don’t rely on it alone. Combine it with support/resistance and trend analysis.
Final Thoughts
Volume is one of the most powerful tools in trading. It confirms trends, filters fakeouts, and helps spot reversals. If you’re not using volume, you’re trading blind.
Next time you look at a chart, ask yourself: Is this move backed by volume? If not, think twice before jumping in.
Master volume analysis, and you’ll gain an edge over most traders.
FAQs
Yes, volume analysis is useful across stocks, forex (via tick volume), futures, and even cryptocurrencies. However, forex volume data is not centralized, so it may not be as precise as stock market volume.
Volume is typically lower during pre-market and after-hours sessions because fewer traders participate. This can lead to less reliable price movements and increased volatility due to lower liquidity.
In intraday trading, volume is crucial for identifying high-probability trades. Sudden spikes in volume often indicate key levels of interest, signaling potential breakouts or reversals within the trading day.
Yes, many traders use algorithms to track volume changes and execute trades based on volume-based indicators like VWAP, OBV, or relative volume spikes. This helps remove emotions from trading decisions.
Declining volume in an uptrend suggests weakening buying interest, increasing the risk of a reversal. Similarly, in a downtrend, falling volume can signal that selling pressure is fading, potentially leading to a bounce or consolidation.
We'd Love to Hear Your Thoughts on This Article!
Was this writing helpful?
 Yes No
Trust with CoinPedia:
CoinPedia has been delivering accurate and timely cryptocurrency and blockchain updates since 2017. All content is created by our expert panel of analysts and journalists, following strict Editorial Guidelines based on E-E-A-T (Experience, Expertise, Authoritativeness, Trustworthiness). Every article is fact-checked against reputable sources to ensure accuracy, transparency, and reliability. Our review policy guarantees unbiased evaluations when recommending exchanges, platforms, or tools. We strive to provide timely updates about everything crypto & blockchain, right from startups to industry majors.
Investment Disclaimer:
All opinions and insights shared represent the author's own views on current market conditions. Please do your own research before making investment decisions. Neither the writer nor the publication assumes responsibility for your financial choices.
Sponsored and Advertisements:
Sponsored content and affiliate links may appear on our site. Advertisements are marked clearly, and our editorial content remains entirely independent from our ad partners.


