- Nidhi Kolhapur
 Nidhi Kolhapur
Nidhi is a Certified Digital Marketing Executive and Passionate crypto Journalist covering the world of alternative currencies. She shares the latest and trending news on Cryptocurrency and Blockchain.
- Dec 31, 2023 07:15 UTC
Unlocking Crypto Trading Success: The Essentials of Price Action and Candlesticks
Have you ever looked at a stock or crypto chart and felt like you were staring at a foreign language? All those lines, bars, and colors—what do they even mean?
Well, here’s the good news: The secret to understanding price movements lies in something called price action. And once you grasp it, trading will make a lot more sense.
In this guide, we’ll break down price action, candlestick patterns, and how you can use them to make better trading decisions. So, grab a coffee and let’s dive in!
What Is Price Action?
Price action is simply the movement of a security’s price over time. It’s what you see on a chart—the ups, the downs, and everything in between.
Traders use price action to analyze and predict future price movements without relying on indicators like RSI, MACD, or moving averages. Instead, they focus purely on how price behaves.
Think of it like reading body language. If someone is smiling, they’re probably happy. If a stock is making higher highs and higher lows, it’s probably in an uptrend.
Understanding Price Action
Price action is based on supply and demand. When buyers are in control, prices go up. When sellers dominate, prices fall.
To get a better grasp, let’s break it down further:
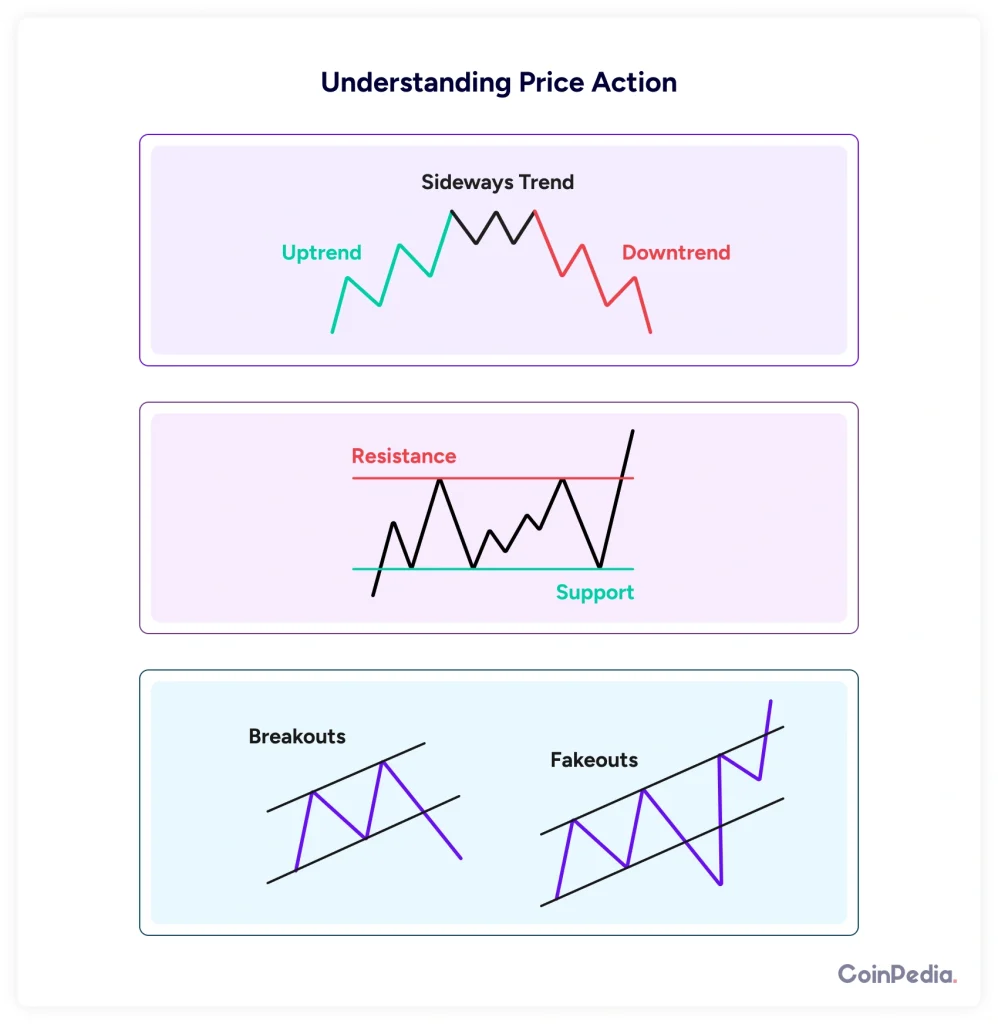
1. Trends
- Uptrend: Price is making higher highs and higher lows. Buyers are in control.
- Downtrend: Price is making lower highs and lower lows. Sellers are in control.
- Sideways Trend: Price moves within a range. Neither buyers nor sellers are dominant.
2. Support and Resistance
- Support: A price level where demand is strong enough to stop the price from falling further.
- Resistance: A level where selling pressure prevents the price from rising further.
Example: If Bitcoin keeps bouncing off $30,000 and never goes lower, that level acts as support. If it struggles to break above $40,000, that’s resistance.
3. Breakouts and Fakeouts
- Breakout: When price moves past a key level (support or resistance) with strong momentum.
- Fakeout: When price appears to break out but then reverses, trapping traders who entered too early.
How to Use Price Action
Price action can be used in multiple ways, but here are three common strategies:
1. Trend Trading
If you see an uptrend, you buy on pullbacks (when price dips slightly). If it’s a downtrend, you sell on rallies (when price spikes up slightly).
2. Breakout Trading
Wait for the price to break above resistance or below support, then enter a trade with strong momentum.
3. Reversal Trading
Look for signs that a trend is ending. For example, if an uptrend starts forming lower highs, it might be losing strength.
Limitations of Price Action
Price action is powerful, but it’s not foolproof. Here’s why:
- It’s subjective – Two traders might look at the same chart and see different patterns.
- It doesn’t predict the future – It tells you what’s likely, but there are no guarantees.
- False signals happen – Breakouts sometimes fail. Trends sometimes reverse unexpectedly.
This is why experienced traders combine price action with other tools like volume analysis, market sentiment, and news events to make smarter trades.
What Are Candlestick Patterns?
Candlestick patterns are a visual representation of price action. They tell you how the price moved within a specific time frame (1 minute, 1 hour, 1 day, etc.).
A candlestick consists of:
- Body: Represents the opening and closing price.
- Wicks (or shadows): Show the highest and lowest price during the time frame.
When you look at candlestick charts, you’re seeing the battle between buyers and sellers play out in real-time.
Basic Candlestick Patterns
Some candlestick patterns can help you spot trend reversals or continuations. Here are a few:
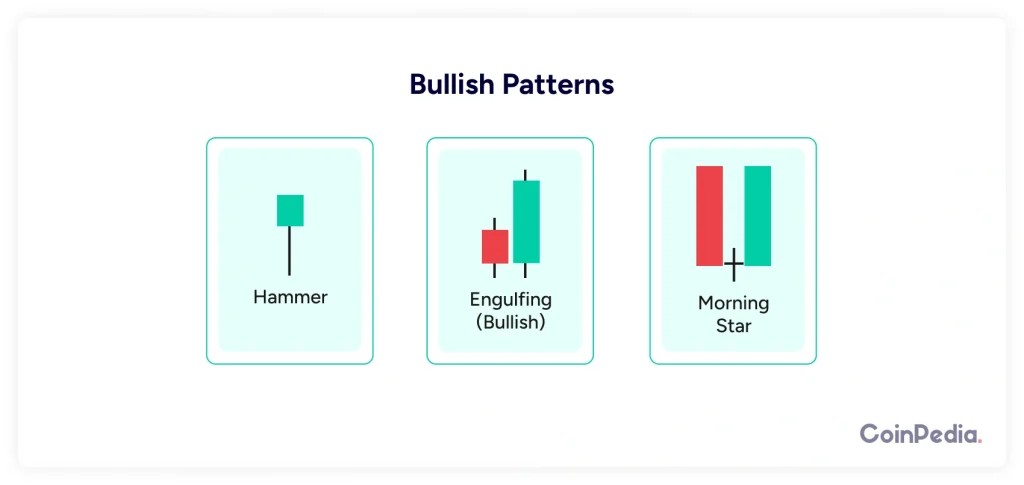
1. Bullish Patterns (Signal Price May Go Up)
Hammer
- Small body, long lower wick.
- Appears after a downtrend.
- Means buyers are stepping in.
Engulfing (Bullish)
- A large green candle fully engulfs the previous red candle.
- Shows strong buying pressure.
Morning Star
- A three-candle pattern: Red candle → Small indecisive candle → Green candle.
- Suggests a trend reversal to the upside.
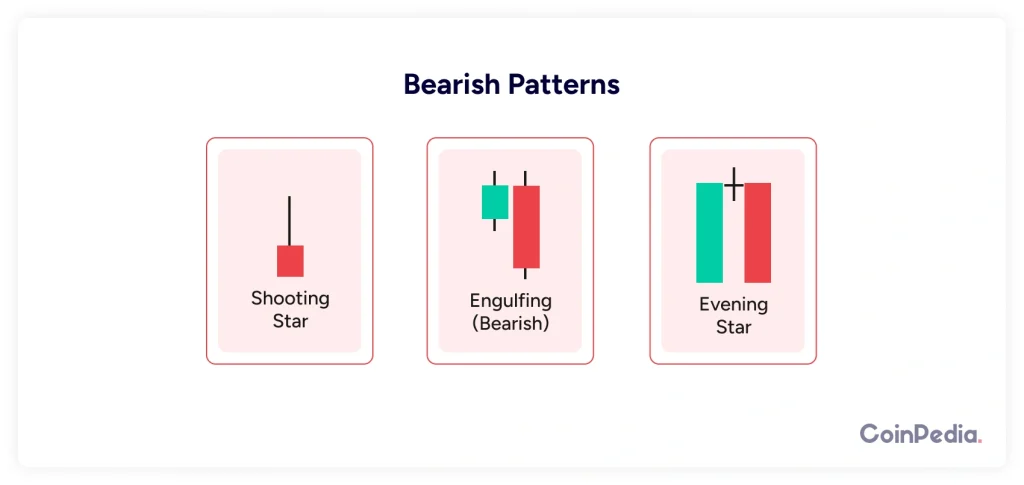
2. Bearish Patterns (Signal Price May Go Down)
Shooting Star
- Small body, long upper wick.
- Appears after an uptrend.
- Means sellers are stepping in.
Engulfing (Bearish)
- A large red candle fully engulfs the previous green candle.
- Shows strong selling pressure.
Evening Star
- A three-candle pattern: Green candle → Small indecisive candle → Red candle.
- Suggests a trend reversal to the downside.
Final Thoughts
Trading is all about understanding price movements. Price action and candlestick patterns are among the most powerful tools to do that.
To summarize:
- Price action tells you the story of supply and demand.
- Candlestick patterns help visualize that story.
- No strategy is perfect—always manage your risk.
Now that you have this knowledge, go and look at some charts. Try spotting trends, support, resistance, and candlestick patterns. The more you practice, the better you’ll get!
FAQs
Yes! Price action works for stocks, crypto, forex, commodities—basically, any market where price moves. Since it’s based on human psychology and market behavior, it applies universally.
There’s no fixed timeline. Some traders grasp it in a few months, while others take years to refine their skills. The key is consistent practice, reviewing past trades, and continuously learning.
It depends on your trading style.
Day traders use lower timeframes (5-minute, 15-minute).
Swing traders prefer 4-hour or daily charts.
Long-term investors focus on weekly or monthly charts.
Yes, though candlestick patterns make it easier to interpret. Price action traders also look at trend structure, support/resistance levels, and volume to make decisions.
Neither is inherently better—it depends on the trader. Some prefer a pure price action approach, while others combine it with indicators like moving averages or RSI for extra confirmation.
We'd Love to Hear Your Thoughts on This Article!
Was this writing helpful?
 Yes No
Trust with CoinPedia:
CoinPedia has been delivering accurate and timely cryptocurrency and blockchain updates since 2017. All content is created by our expert panel of analysts and journalists, following strict Editorial Guidelines based on E-E-A-T (Experience, Expertise, Authoritativeness, Trustworthiness). Every article is fact-checked against reputable sources to ensure accuracy, transparency, and reliability. Our review policy guarantees unbiased evaluations when recommending exchanges, platforms, or tools. We strive to provide timely updates about everything crypto & blockchain, right from startups to industry majors.
Investment Disclaimer:
All opinions and insights shared represent the author's own views on current market conditions. Please do your own research before making investment decisions. Neither the writer nor the publication assumes responsibility for your financial choices.
Sponsored and Advertisements:
Sponsored content and affiliate links may appear on our site. Advertisements are marked clearly, and our editorial content remains entirely independent from our ad partners.


