Understanding Basic Candlestick Charts: A Beginner’s Path to Trading Proficiency
Qadir Ak is the founder of Coinpedia. He has over a decade of experience writing about technology and has been covering the blockchain and cryptocurrency space since 2010. He has also interviewed a few prominent experts within the cryptocurrency space.
Mustafa has been writing about Blockchain and crypto since many years. He has previous trading experience and has been working in the Fintech industry since 2017.


Think you’re walking into a room full of people speaking a language you don’t understand. They are communicating, but you’re lost. Now, picture someone handing you a guide that instantly translates everything. Suddenly, you’re in on the conversation.
That’s what candlestick patterns do for traders. They translate market sentiment, showing who’s in control—the buyers or the sellers. If you can read them, you gain an edge. You see things others miss. And most importantly, you make better trading decisions.
If you’ve ever stared at a price chart and felt overwhelmed, don’t worry. By the end of this guide, you’ll know how to read candlestick patterns like a pro. Ready? Let’s dive in.
What Are Candlestick Patterns?
Candlestick patterns are visual representations of price movements in a given timeframe. Each candlestick shows four key pieces of information:

- Open price: Where the price started
- Close price: Where the price ended
- High price: The highest point reached
- Low price: The lowest point reached
A green (or white) candle means the price closed higher than it opened. A red (or black) candle means it closed lower. Simple, right? But the magic is in the patterns.
Why Are Candlestick Patterns Important?
Candlestick patterns help traders predict what might happen next. They show whether buyers (bulls) or sellers (bears) are in control. This gives you an idea of when to buy, sell, or stay out of the market.
For example, imagine you see a pattern that suggests a stock is about to rise. You buy in early, just before the price takes off. That’s the power of understanding candlestick patterns.
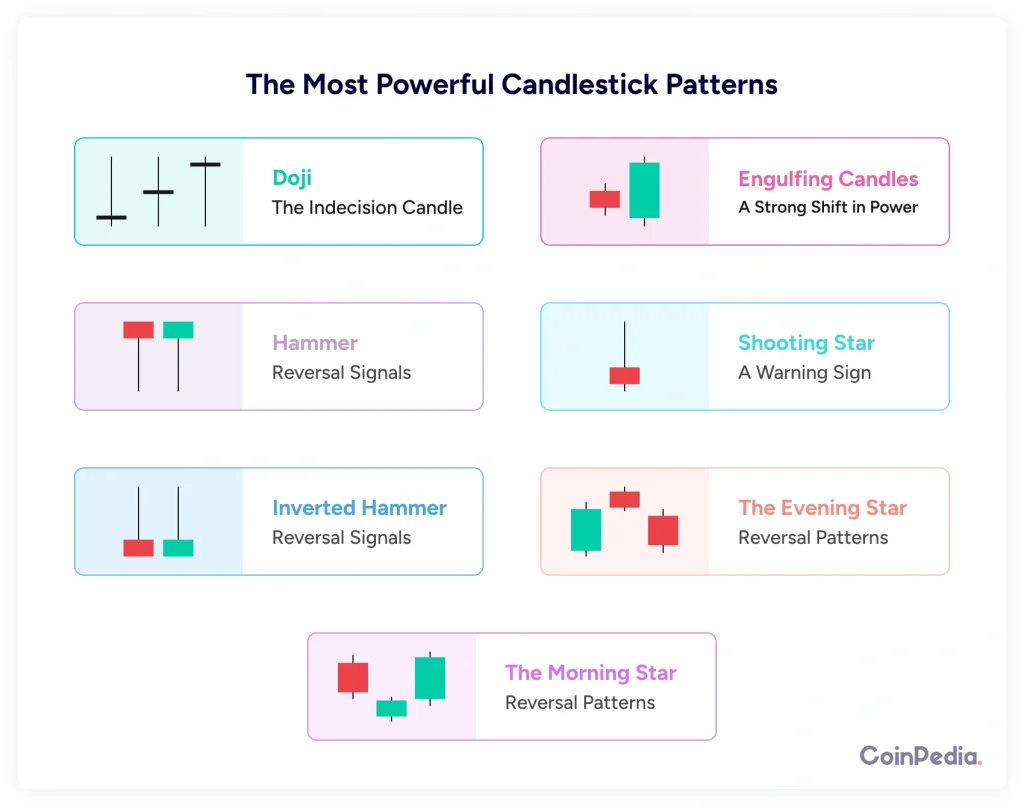
The Most Powerful Candlestick Patterns (With Examples)
Let’s break down some of the most useful candlestick patterns and how they work.
1. Doji – The Indecision Candle
A Doji candle looks like a small cross. The open and close prices are nearly the same, meaning neither buyers nor sellers had full control.
What it means:
- Market is uncertain.
- Could signal a reversal (if found after a strong trend).
Example: Let’s say Bitcoin has been climbing for weeks, then a Doji appears. This could mean the bulls are losing strength, and a reversal might happen soon.
2. Engulfing Candles – A Strong Shift in Power
An Engulfing Candle happens when a larger candle fully “engulfs” the previous one. It signals a strong shift in momentum.
- Bullish Engulfing: A big green candle fully covers the previous red one → buyers are taking over.
- Bearish Engulfing: A big red candle fully covers the previous green one → sellers are in control.
Example: A stock has been dropping for days. Then, a large green engulfing candle appears. This might mean the selling pressure is over and buyers are stepping in.
3. Hammer and Inverted Hammer – Reversal Signals
A Hammer looks like a small body with a long lower wick. It means the price dropped but then bounced back strongly.
- If found after a downtrend, it’s a bullish reversal signal.
- An Inverted Hammer is the same but upside down, meaning possible bullish momentum is coming.
Example: You’re watching Ethereum drop in price. Then, a hammer appears. This tells you buyers are stepping in, and the price might reverse soon.
4. Shooting Star – A Warning Sign
A Shooting Star is the opposite of a hammer. It has a small body and a long upper wick. This means buyers pushed the price up, but sellers quickly took control.
What it means:
- Found at the top of an uptrend? It’s a warning that a reversal might be coming.
Example: A stock has been climbing for weeks. Then, a shooting star appears. This could mean it’s time to take profits before the price drops.
5. The Morning Star and Evening Star – Reversal Patterns
- Morning Star (Bullish Reversal): Three-candle pattern where the middle candle is small and signals a shift from sellers to buyers.
- Evening Star (Bearish Reversal): The opposite of a morning star, signaling a shift from buyers to sellers.
Example: You see a morning star after a downtrend in Bitcoin. This could mean buyers are ready to push the price back up.
How to Use Candlestick Patterns in Trading
Reading candlestick patterns is great, but you need a plan. Here’s how to use them effectively:
1. Combine With Other Indicators
Candlestick patterns work best when used with other tools like:
- Moving Averages (To see the trend)
- Relative Strength Index (RSI) (To spot overbought/oversold levels)
- Volume (To confirm strong moves)
Example: A bullish engulfing candle with high volume and RSI bouncing from oversold? That’s a strong buy signal.
2. Look at the Context
A hammer in an uptrend? Not very useful. A hammer at the bottom of a downtrend? That’s a buy signal. Always analyze patterns within the bigger trend.
3. Be Patient – Wait for Confirmation
One candle alone isn’t enough. Always wait for confirmation. Example: After a morning star, see if the next candle continues upward before entering a trade.
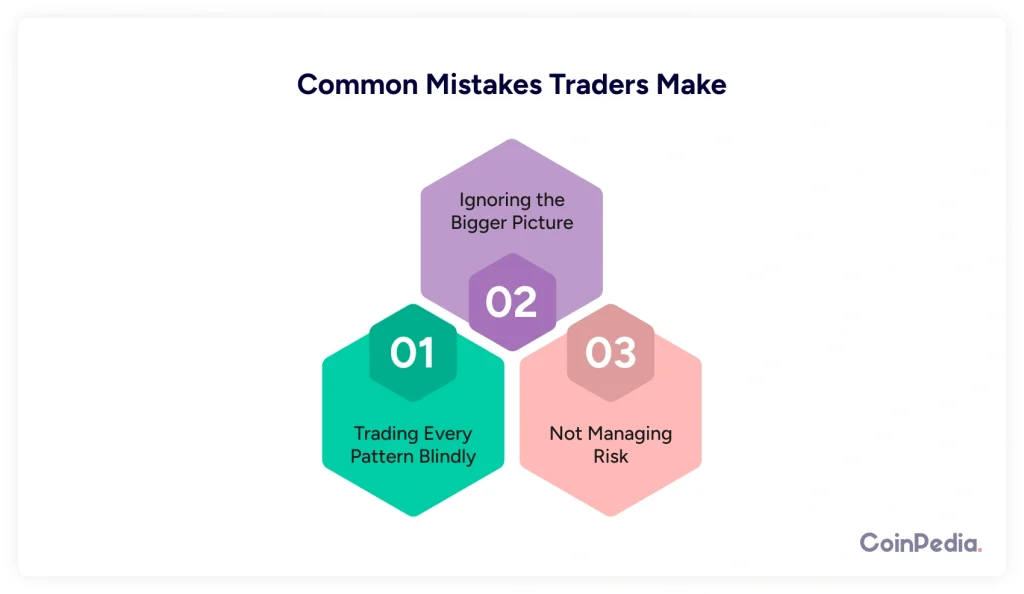
Common Mistakes Traders Make (And How to Avoid Them)
1. Trading Every Pattern Blindly
Just because you see a pattern doesn’t mean it will work. Always combine patterns with trend analysis and volume.
2. Ignoring the Bigger Picture
If the overall market is crashing, even the best bullish pattern won’t save you. Zoom out and check the trend.
3. Not Managing Risk
Set stop losses. Don’t risk more than you can afford to lose. Even the best setups can fail.
Final Thoughts
Candlestick patterns are like a secret weapon for traders. They reveal what buyers and sellers are thinking and help you predict price movements. But remember—patterns alone aren’t enough. Combine them with other tools, manage your risk, and always look at the bigger picture.
Start small. Practice reading charts daily. Over time, you’ll start spotting opportunities before others do.
FAQs
Yes, candlestick patterns work on all timeframes, from one-minute charts to monthly charts. However, patterns on higher time frames (like daily or weekly) tend to be more reliable than those on lower timeframes.
Absolutely! Candlestick patterns can be used in stocks, forex, commodities, and crypto. However, crypto markets can be more volatile, so it’s important to combine candlestick analysis with other indicators for better accuracy.
A strong pattern is usually confirmed by factors like high trading volume, trend alignment, and follow-through price action in the next few candles. Waiting for confirmation before entering a trade can help reduce false signals.
Not always. Single candlestick patterns like Doji or Hammer provide useful insights, but multi-candle patterns (like Engulfing or Morning Star) tend to be stronger as they show a more developed shift in market sentiment.
No, candlestick patterns help predict direction but not exact price targets. To set profit targets, traders often use support/resistance levels, Fibonacci retracements, or moving averages alongside candlestick analysis.
Well Done! You have now completed the Lesson.
Complete the Quiz and Get Certified! All The Best!
Was this writing helpful?
Disclaimer and Risk Warning
The information provided in this content by Coinpedia Academy is for general knowledge and educational purpose only. It is not financial, professional or legal advice, and does not endorse any specific product or service. The organization is not responsible for any losses you may experience. And, Creators own the copyright for images and videos used. If you find any of the contents published inappropriate, please feel free to inform us.