- Qadir AK
 Qadir AK
Qadir Ak is the founder of Coinpedia. He has over a decade of experience writing about technology and has been covering the blockchain and cryptocurrency space since 2010. He has also interviewed a few prominent experts within the cryptocurrency space.
- Jan 05, 2024 08:52 UTC
Trade with Confidence: Flags and Pennants in Crypto Explained
Imagine this. You’re staring at a price chart, trying to figure out what happens next. The market has been moving fast, and now it’s taking a break. But is this just a pause before another big move, or is it the start of a reversal?
This is where flags and pennants come in. These patterns are like a secret language in trading. They tell you when a trend is likely to continue. If you understand them well, you can use them to find great entry and exit points.
So, let’s break it down step by step. No complicated jargon. Just simple, practical knowledge that you can start using today.
What Are Flags and Pennants?
Flags and pennants are continuation patterns. This means they form in the middle of a strong price move, and they signal that the trend is likely to continue once the pattern is complete.
They are common in all types of markets—stocks, forex, crypto, commodities. Wherever there’s price action, you’ll see these patterns appear.
Here’s a simple way to think about them:
- Flag: Picture a flag waving on a pole. That’s exactly what a flag pattern looks like on a chart.
- Pennant: This one looks like a small triangle, showing price tightening before the next move.
Now, let’s break each one down in detail.
Flags: The Momentum Booster
A flag pattern has two main parts:
- The Flagpole – This is a strong price move up or down.
- The Flag – This is a small pullback that moves in the opposite direction of the trend.
A flag can be either bullish or bearish.
Bullish Flag
- Starts with a sharp rise in price (flagpole).
- Then, the price moves slightly downward in a parallel channel (flag).
- Finally, the price breaks out upwards, continuing the trend.
Example: Imagine a stock price surges from $50 to $65 in a few days. Then, it pulls back slightly to $62, moving sideways in a tight range. If the stock breaks above $65 again, that confirms the bullish flag pattern.
Bearish Flag
- Starts with a sharp drop in price.
- Then, the price moves slightly upward in a parallel channel.
- Finally, the price breaks downward, continuing the trend.
Example: A cryptocurrency falls from $30,000 to $25,000 rapidly. Then, it moves up slightly to $26,000 but stays within a narrow range. If it drops below $25,000, that confirms the bearish flag.
How to Trade Flags
- Find a strong trend – If there’s no strong price movement before the flag forms, don’t trade it.
- Wait for the breakout – The pattern is only valid if the price breaks out in the direction of the trend.
- Set a stop-loss – Place it just outside the opposite side of the flag.
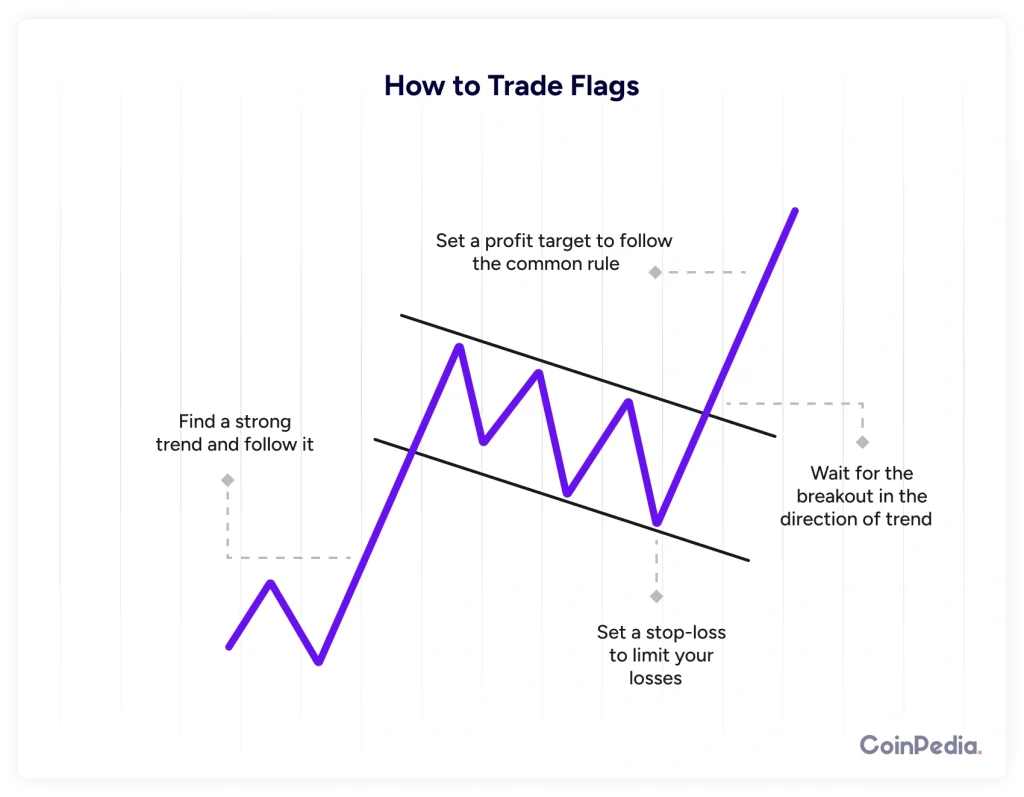
Set a profit target – A common rule is to measure the height of the flagpole and project it from the breakout point.
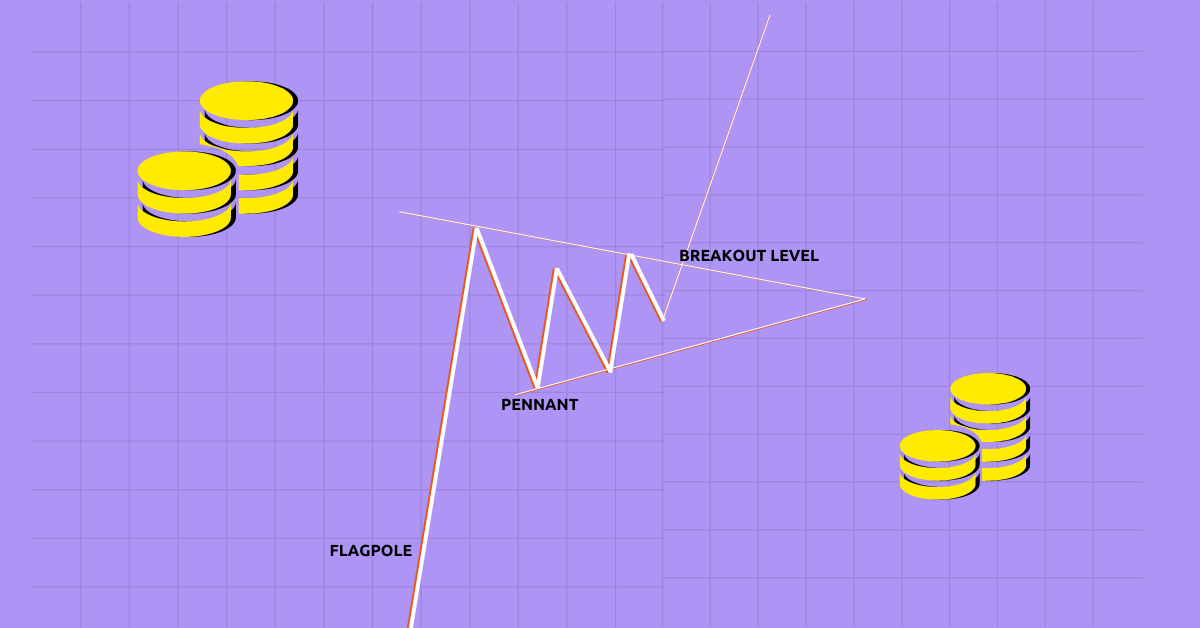
Pennants: The Breakout Indicator
Pennants are similar to flags, but instead of a rectangular pullback, they form a small triangle. The price action tightens before breaking out.
A pennant has three main parts:
- The Flagpole – A strong move up or down.
- The Pennant – Price consolidates in a triangle shape.
- The Breakout – Price breaks out and continues the trend.
Bullish Pennant
- Price surges up, forming a flagpole.
- Then, the price consolidates in a small triangle.
- If the price breaks above the pennant, the uptrend continues.
Example: Let’s say gold prices jump from $1,800 to $1,950. Then, the price moves within a small range, forming a triangle. If it breaks above $1,950, the bullish pennant is confirmed.
Bearish Pennant
- Price drops sharply, forming a flagpole.
- Then, the price consolidates in a small triangle.
- If the price breaks below the pennant, the downtrend continues.
Example: A stock drops from $200 to $180. Then, the price moves in a tightening range, forming a triangle. If it breaks below $180, the bearish pennant is confirmed.
How to Trade Pennants
- Identify a strong trend – Pennants work best when there’s strong momentum before they form.
- Wait for a breakout – If the price moves outside the pennant, that’s your signal.
- Use stop-losses – Place your stop-loss just outside the opposite end of the pennant.
- Take profits – Measure the flagpole and project that distance from the breakout point.
Key Differences Between Flags and Pennants
- Shape – Flags form a rectangular channel, while pennants form a small triangle.
- Price Action – In a flag, price moves in parallel lines. In a pennant, price tightens into a point.
- Breakout Signal – A flag breaks above or below the flag pattern, while a pennant breaks above or below the triangle.
- Works Best In – Both patterns work best in strong trends.
Common Mistakes Traders Make
- Forcing a pattern – Not every consolidation is a flag or pennant. Be patient and wait for clear setups.
- Trading too early – Wait for a breakout before entering. Jumping in too soon can lead to losses.
- Ignoring volume – A breakout with high volume is stronger. If volume is low, the breakout might fail.
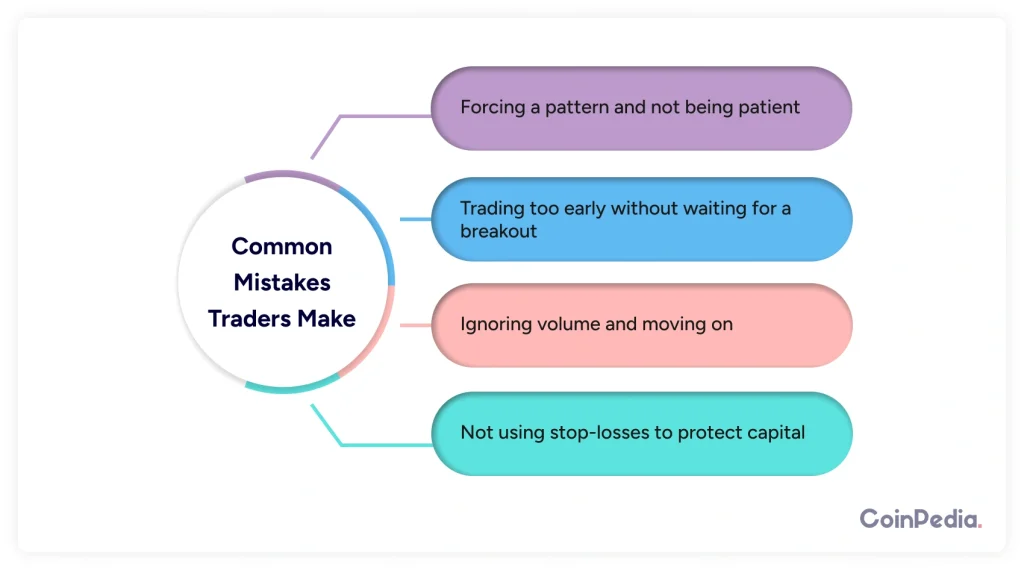
Not using stop-losses – Always protect your capital with stop-loss orders.
Final Thoughts
Flags and pennants are powerful tools in a trader’s arsenal. They help you catch strong moves while keeping risk in check. The key is to wait for the right setup and manage your risk properly.
Next time you look at a price chart, see if you can spot a flag or a pennant. Practice recognizing them, and soon you’ll be using them like a pro.
Trading is all about stacking the odds in your favor. And knowing these patterns gives you an edge.
Also read: Beyond Basics: Price Action and Support/Resistance for Proficient Crypto Trading
FAQs
Yes! Indicators like the RSI (Relative Strength Index) and MACD (Moving Average Convergence Divergence) can help confirm breakouts. For example, if an RSI is above 50 during a bullish flag breakout, it strengthens the trade setup.
Ideally, volume should decrease as the pattern forms (during consolidation) and then spike when the breakout happens. A breakout with low volume may be weaker and prone to failure.
Yes, false breakouts are common. That’s why waiting for confirmation (like a strong candle close outside the pattern) and using stop-losses are crucial.
No pattern is 100% reliable. While they indicate high-probability moves, external factors like news or sudden market shifts can change the direction.
Yes! While many traders use leverage to maximize profits, you can trade flags and pennants with a spot position and still make decent gains if the move is strong.
We'd Love to Hear Your Thoughts on This Article!
Was this writing helpful?
 Yes No
Trust with CoinPedia:
CoinPedia has been delivering accurate and timely cryptocurrency and blockchain updates since 2017. All content is created by our expert panel of analysts and journalists, following strict Editorial Guidelines based on E-E-A-T (Experience, Expertise, Authoritativeness, Trustworthiness). Every article is fact-checked against reputable sources to ensure accuracy, transparency, and reliability. Our review policy guarantees unbiased evaluations when recommending exchanges, platforms, or tools. We strive to provide timely updates about everything crypto & blockchain, right from startups to industry majors.
Investment Disclaimer:
All opinions and insights shared represent the author's own views on current market conditions. Please do your own research before making investment decisions. Neither the writer nor the publication assumes responsibility for your financial choices.
Sponsored and Advertisements:
Sponsored content and affiliate links may appear on our site. Advertisements are marked clearly, and our editorial content remains entirely independent from our ad partners.


