Ascending vs. Descending Triangles: How to Trade These Powerful Patterns
Qadir Ak is the founder of Coinpedia. He has over a decade of experience writing about technology and has been covering the blockchain and cryptocurrency space since 2010. He has also interviewed a few prominent experts within the cryptocurrency space.


Have you ever watched a stock or crypto chart and felt like it was speaking a secret language? Well, you’re not alone. Patterns in charts tell stories about what’s happening in the market. And if you learn to read them, they can give you a serious edge in trading.
Today, we’re diving into two of the most powerful patterns: Ascending and Descending Triangles. These formations can help traders predict where the market is headed next. Whether you’re new to trading or looking to refine your skills, understanding these patterns is a must.
What Are Ascending and Descending Triangles?
Imagine price movements drawing shapes on your chart. Triangles are one of the most common patterns, and they usually signal a breakout is coming.
- Ascending Triangle: This pattern happens when there’s a horizontal resistance level at the top, but the price keeps making higher lows at the bottom. It shows that buyers are getting stronger and pushing the price up.
- Descending Triangle: This one is the opposite. There’s a horizontal support level at the bottom, but the highs keep getting lower. This signals that sellers are taking control and pushing prices down.
Both patterns suggest that the market is gearing up for a breakout. The key is knowing which way it’s likely to go and how to trade it.

Understanding the Ascending Triangle
1. What It Looks Like
Think of an ascending triangle like a rising staircase hitting a ceiling. The price keeps knocking on that ceiling (resistance level), and each time, it comes back down—but not as low as before.
Here’s what you’ll see:
- A flat resistance line at the top.
- Higher lows forming at the bottom, creating an upward-sloping trendline.
2. What It Means
An ascending triangle suggests that buyers are gaining momentum. Even though the price keeps hitting resistance, it doesn’t fall as far each time. This means demand is increasing, and eventually, the buyers may have enough strength to break through the resistance.
3. How to Trade It
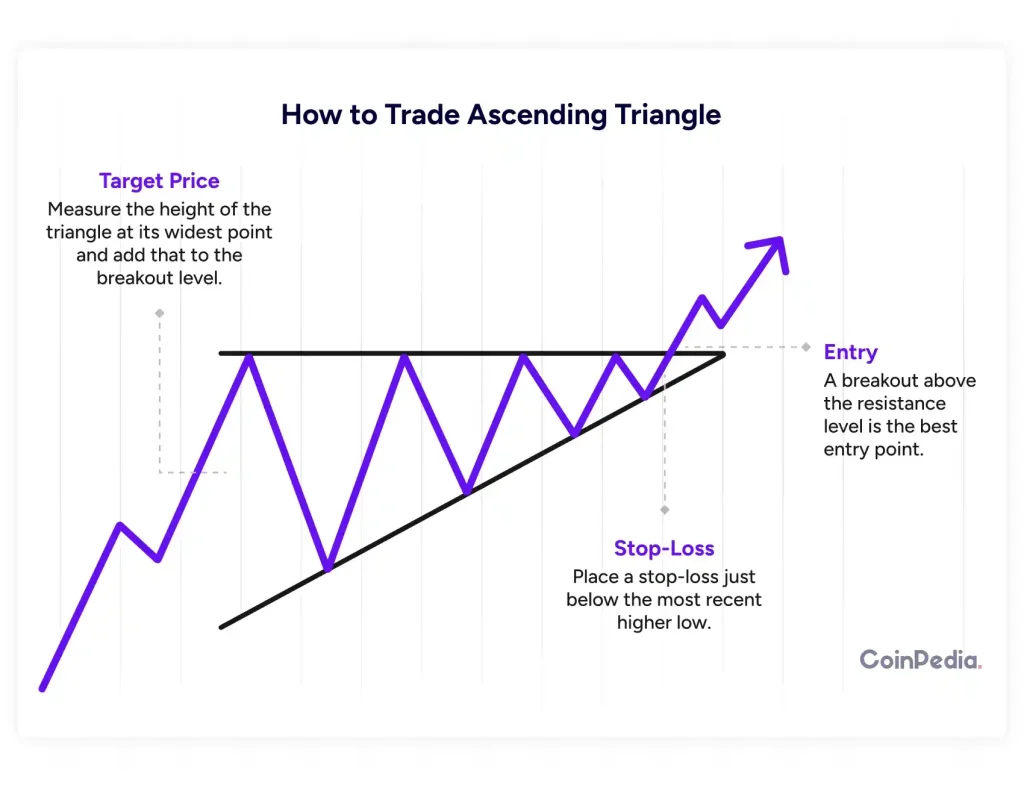
- Entry: A breakout above the resistance level is the best entry point. Once the price closes above the resistance with strong volume, it’s a sign that buyers have taken over.
- Stop-Loss: Place a stop-loss just below the most recent higher low. This minimizes risk in case the breakout fails.
- Target Price: Measure the height of the triangle at its widest point and add that to the breakout level. This gives you an idea of how far the price might move after the breakout.
4. Example
Let’s say Bitcoin is trading in an ascending triangle. The resistance is at $50,000, but each dip goes higher—$45,000, then $46,500, then $48,000. Eventually, the price breaks above $50,000 with a surge in volume. This confirms the breakout, and traders jump in, expecting a rally to around $55,000 (if the triangle’s height is $5,000).
Understanding the Descending Triangle
1. What It Looks Like
Now, flip the ascending triangle upside down. Instead of knocking on a ceiling, the price is bouncing off a floor—but each time, it falls from a lower high.
Here’s what you’ll see:
- A flat support line at the bottom.
- Lower highs forming at the top, creating a downward-sloping trendline.
2. What It Means
A descending triangle suggests that sellers are in control. Even though the price keeps bouncing off support, the sellers are pushing it lower each time. This weakens the support level, and eventually, it might break.
3. How to Trade It
- Entry: A breakdown below the support level is the best entry point. If the price falls below support with strong volume, it’s a sign that sellers have overpowered buyers.
- Stop-Loss: Place a stop-loss just above the most recent lower high to protect against a false breakout.
- Target Price: Measure the height of the triangle and subtract it from the breakdown point to estimate the target price.
4. Example
Imagine Ethereum is forming a descending triangle with support at $2,500. The highs keep getting lower—$3,200, then $3,000, then $2,800. Finally, the price breaks below $2,500, signaling a potential drop to around $2,000 if the triangle’s height was $500.
Key Differences Between the Two
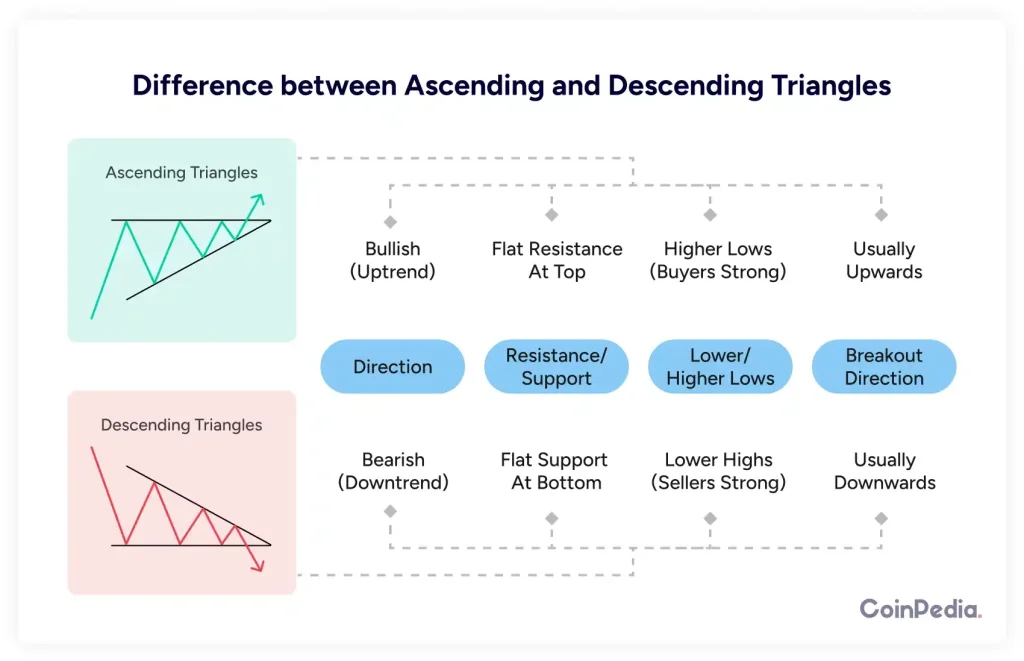
An ascending triangle is a bullish pattern, typically signaling an uptrend, while a descending triangle is bearish, indicating a potential downtrend. In an ascending triangle, the resistance level remains flat at the top, but the price forms higher lows at the bottom, showing strong buying pressure.
In contrast, a descending triangle has a flat support level at the bottom while lower highs form at the top, suggesting increasing selling pressure.
The breakout direction of an ascending triangle is usually upwards, whereas in a descending triangle, it tends to break downward. Recognizing these differences can help traders make informed decisions and position themselves accordingly.
Common Mistakes to Avoid
- Jumping in Too Early: Wait for a confirmed breakout. A false breakout can trick traders into entering too soon.
- Ignoring Volume: A breakout without strong volume can be unreliable.
- Forgetting Stop-Losses: Always protect your capital by setting stop-losses. Not every pattern plays out perfectly.
- Trading Small Triangles: The larger the triangle, the stronger the breakout. Tiny triangles might not give strong moves.
- Forcing Trades: If the pattern isn’t clear, don’t force a trade. There will always be another opportunity.
Final Thoughts
Ascending and descending triangles are powerful tools in a trader’s arsenal. They give you a structured way to anticipate breakouts and manage risk. By combining these patterns with volume analysis and proper risk management, you can increase your chances of making profitable trades.
Next time you see a chart, look out for these triangles. They might just give you the edge you need to make smarter, more confident trading decisions.
Also read: Trading vs Investing: What’s the Difference and What’s Right for You?
FAQs
An ascending triangle is a bullish chart pattern with a flat resistance level and higher lows, signaling an upward breakout when buyers gain strength.
Trade a descending triangle by waiting for a breakdown below support with high volume, entering short, setting a stop-loss above the last lower high.
Not always. False breakouts can occur, so traders confirm with volume analysis and other indicators before entering trades.
Well Done! You have now completed the Lesson.
Complete the Quiz and Get Certified! All The Best!
Was this writing helpful?
Disclaimer and Risk Warning
The information provided in this content by Coinpedia Academy is for general knowledge and educational purpose only. It is not financial, professional or legal advice, and does not endorse any specific product or service. The organization is not responsible for any losses you may experience. And, Creators own the copyright for images and videos used. If you find any of the contents published inappropriate, please feel free to inform us.