Have you ever looked at a price chart and wondered if there was a simple way to spot high-probability trades? If so, let me introduce you to the inside bar pattern.
This pattern is one of the most effective tools traders use to catch strong moves in the market. It signals a moment of indecision before a big breakout. Think of it as a spring being compressed before it launches forward. If you understand how to trade inside bars, you can position yourself ahead of powerful price movements.
In this guide, we’ll break down everything you need to know. We’ll keep it simple, use examples, and make sure you leave with a clear strategy.
What is an Inside Bar Pattern?
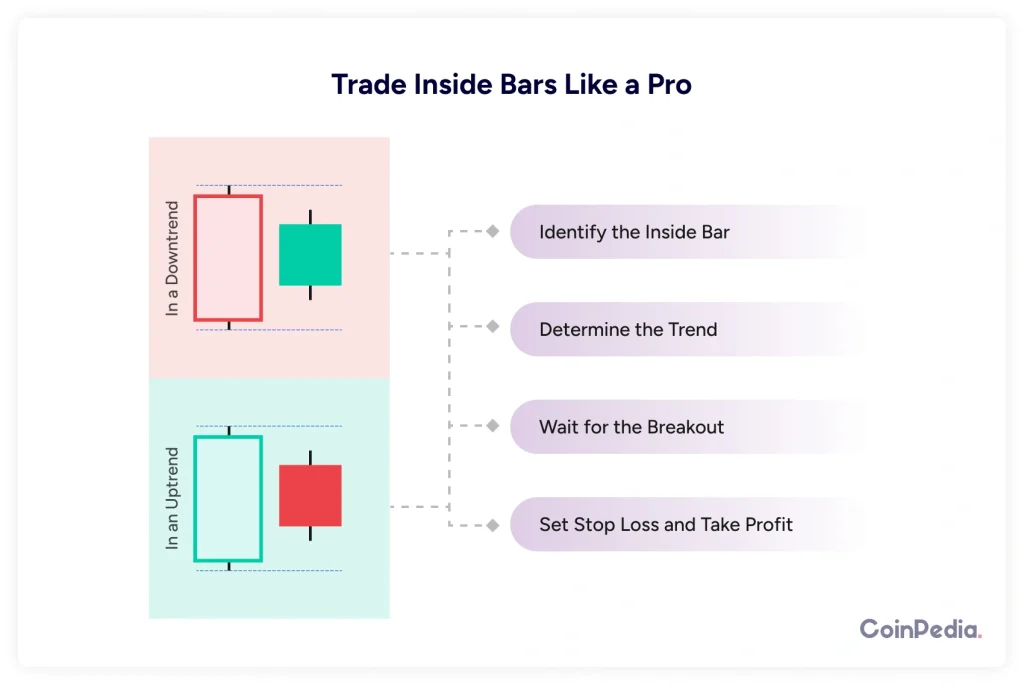
An inside bar pattern consists of two candles. The second candle (inside bar) forms completely within the range of the first candle (mother bar). This means the high of the inside bar is lower than the mother bar’s high, and the low is higher than the mother bar’s low.
Why does this matter?
This pattern shows a period of consolidation. The market pauses before making its next move. When the price finally breaks out, it often leads to a strong move in one direction.
Quick Example:
Imagine Bitcoin is trading at $60,000. One day, it moves between $59,000 and $61,000. The next day, the price stays between $59,500 and $60,500. That second day is an inside bar – price is trapped within the previous day’s range. This means traders are waiting for a breakout!
Why Are Inside Bars Powerful?
Inside bars work because they capture market psychology. When an inside bar forms, buyers and sellers are in a temporary standoff. This creates a coiled-up energy that often leads to explosive moves when one side finally wins.
Think of it like this:
If you shake a soda can and pop it open, what happens? It explodes! That’s exactly what happens with inside bars when the breakout occurs.
Inside bars are common before major market moves, such as after news releases, earnings reports, or key economic events. They also form during trends, acting as resting periods before the price continues in its original direction.
How to Trade Inside Bars Like a Pro
Alright, now let’s get into the practical stuff. How do you actually trade inside bars? Here’s a simple step-by-step guide:
1. Identify the Inside Bar
First, scan the chart for an inside bar pattern. Make sure the inside bar is completely within the mother bar’s range. If it’s slightly outside, it’s not a valid setup.
2. Determine the Trend
Inside bars work best when traded with the trend. If the market is in an uptrend, you should look for bullish breakouts. If it’s in a downtrend, look for bearish breakouts.
3. Wait for the Breakout
Now, this is the key. You don’t enter a trade just because you see an inside bar. You wait for confirmation – a breakout above or below the mother bar.
- If price breaks above the mother bar’s high, go long (buy)
- If price breaks below the mother bar’s low, go short (sell)
4. Set Stop Loss and Take Profit
Risk management is everything in trading. Here’s how you can set your stop loss:
- For a buy trade, place your stop loss just below the inside bar’s low.
- For a sell trade, place your stop loss just above the inside bar’s high.
For take profit, aim for at least 2x the risk. If your stop loss is 20 pips away, aim for a 40-pip profit.

Example:
Let’s say EUR/USD is in an uptrend. You spot an inside bar where the mother bar’s range is 1.1200 to 1.1250. The inside bar forms between 1.1210 and 1.1240. If the price breaks above 1.1250, you enter a buy trade, setting your stop loss at 1.1210 and your take profit at 1.1290.
When to Avoid Inside Bars
Not every inside bar is a good trade. Here are some cases where you should be cautious:
- Choppy Markets – If the market is moving sideways without a clear trend, inside bars may produce false breakouts.
- Low Volume Periods – If the market is slow (e.g., during holidays), inside bars may not be reliable.
- Near Major Resistance/Support – If the price is approaching a strong support or resistance level, it may fake out traders before reversing.
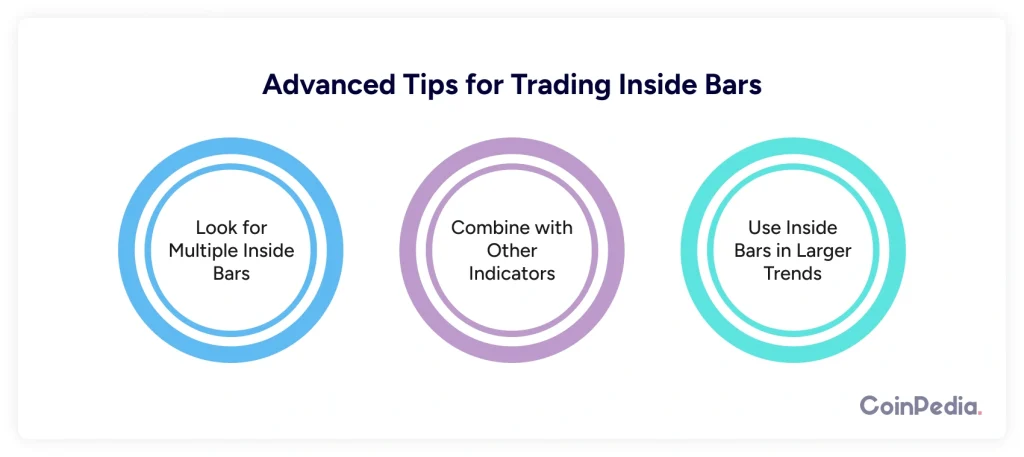
Advanced Tips for Trading Inside Bars
Want to improve your inside bar strategy? Here are some advanced tricks:
1. Look for Multiple Inside Bars
Sometimes, you’ll see two or even three inside bars stacked together. This means even stronger consolidation, leading to a bigger breakout.
2. Combine with Other Indicators
To increase accuracy, use inside bars with:
- Moving Averages – Trade in the direction of the trend.
- RSI (Relative Strength Index) – Avoid overbought/oversold areas.
- Fibonacci Levels – Inside bars at key Fib levels can be powerful signals.
3. Use Inside Bars in Larger Trends
If a stock is in a long-term uptrend, look for bullish inside bars on lower time frames (e.g., daily inside bars within a weekly trend). This gives you extra confidence in your trades.

Trading inside bars is one of the simplest yet most powerful strategies you can use. It helps you catch strong breakouts while managing risk effectively.
Also Read: Simplest Guide to Candlestick Mastery in Cryptocurrency Trading
To recap:
- Inside bars signal consolidation before a big move.
- Trade inside bars in the direction of the trend.
- Wait for a breakout before entering.
- Use stop loss and take profit wisely.
- Avoid trading in choppy markets or low-volume periods.
Now that you know how to trade inside bars, start watching for them in your charts. The more you practice, the better you’ll get. Inside bars might just become your new favorite trading tool!
FAQs
Inside bars can be traded on any timeframe, but they are most effective on higher time frames like the daily (D1) and 4-hour (H4) charts. Lower time frames, such as 15-minute or 1-hour, may have more false breakouts due to market noise.
To reduce false breakouts, trade inside bars in the direction of the overall trend. Also, wait for a strong breakout candle with higher volume and consider using additional indicators like moving averages or support/resistance levels for confirmation.
Inside bars work best in trending markets because they signal a pause before the trend continues. In ranging markets, breakouts can be unpredictable. If you trade inside bars in a range, ensure they are near strong support or resistance levels.
An inside bar is a candle that is completely within the range of the previous bar, signaling consolidation before a breakout. A pin bar has a long wick and a small body, indicating rejection of a price level and potential reversal.
Not necessarily. A good approach is to wait for a strong close above or below the mother bar. Some traders also use a stop-limit order slightly above/below the breakout point to avoid fake moves.
We'd Love to Hear Your Thoughts on This Article!
Was this writing helpful?
 Yes
Yes  No
No
Trust with CoinPedia:
CoinPedia has been delivering accurate and timely cryptocurrency and blockchain updates since 2017. All content is created by our expert panel of analysts and journalists, following strict Editorial Guidelines based on E-E-A-T (Experience, Expertise, Authoritativeness, Trustworthiness). Every article is fact-checked against reputable sources to ensure accuracy, transparency, and reliability. Our review policy guarantees unbiased evaluations when recommending exchanges, platforms, or tools. We strive to provide timely updates about everything crypto & blockchain, right from startups to industry majors.
Investment Disclaimer:
All opinions and insights shared represent the author's own views on current market conditions. Please do your own research before making investment decisions. Neither the writer nor the publication assumes responsibility for your financial choices.
Sponsored and Advertisements:
Sponsored content and affiliate links may appear on our site. Advertisements are marked clearly, and our editorial content remains entirely independent from our ad partners.


