- Qadir AK
 Qadir AK
Qadir Ak is the founder of Coinpedia. He has over a decade of experience writing about technology and has been covering the blockchain and cryptocurrency space since 2010. He has also interviewed a few prominent experts within the cryptocurrency space.
- Dec 31, 2023 09:08 UTC
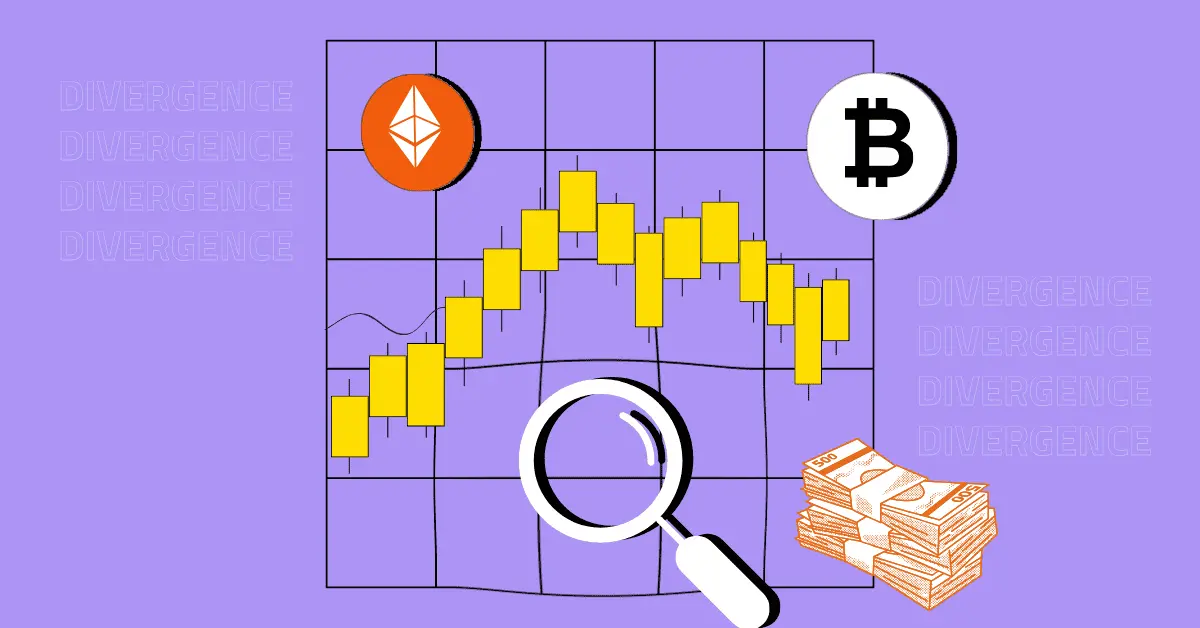
Price Action Divergence: A Crypto Trading Masterclass To Spot The Best Trading Opportunity
When a trader spots a difference between a cryptocurrency’s price action and a technical indicator, it is crucial to take note, as it could signal a potential trading opportunity. This difference is termed as divergence in crypto trading, and there are two types of divergence: bearish and bullish. Bearish divergence suggests a potential downward trend, while bullish divergence indicates a possible upward movement. Now, let’s dive into understanding how to navigate and make excellent trading decisions based on these divergences in cryptocurrency trading. Ready?
1. What Is Price Momentum
Any discussion about divergence in crypto should start with exploring the concept of price momentum.
Price momentum signifies the speed and strength of a cryptocurrency’s price movement. Traders analyse the direction and intensity of price changes, focusing on the length of short-term price swings to measure momentum. Strong momentum is characterised by steep slopes and long swings, while weak momentum shows shallow slopes and short swings.
Traders usually use indicators to analyse momentum. These indicators enable a clearer comparison of indicator swings to price swings.
1.1. Momentum Indicators: What You Should Know
Momentum indicators, like the Relative Strength Index (RSI), Stochastics, and Rate of Change (ROC), are technical analysis tools which assist crypto traders in quantifying the strength and speed of a crypto’s price changes. For instance, RSI measures overbought or oversold conditions, Stochastics identifies potential trend reversals, and ROC measures the percentage change in price over a specified period.
2. Price Action Divergence in Crypto
Divergence in crypto trading occurs when the price of a cryptocurrency moves opposite to a momentum indicator. The divergence naturally suggests a potential shift in market momentum, and often hints at an upcoming price retracement.
In simpler terms, the divergence is a heads-up that the crypto’s current momentum might be fading, opening a window for traders to anticipate and adapt to potential market changes.
3. Types of Price Action Divergence
Divergence in crypto trading comes in three main types: bullish, bearish and hidden.
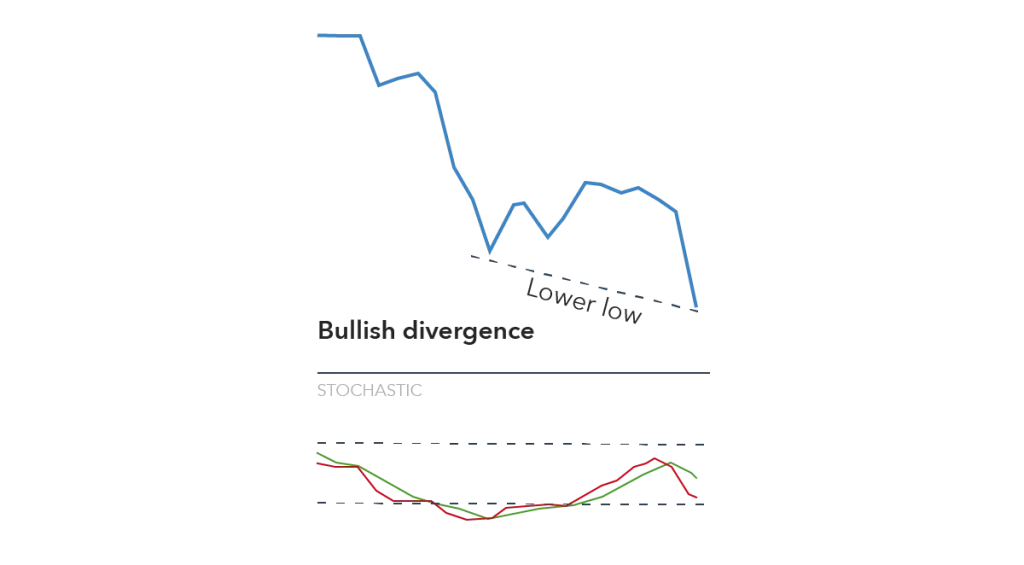
- A bullish divergence arises when prices hit lower lows, but the technical indicator registers higher lows, signalling strengthening market momentum.
- A bearish divergence occurs when prices achieve higher highs, but the indicator shows lower highs, indicating a slowing bullish trend.
- A hidden divergence unfolds when the indicator records higher highs or lower lows while the price action remains stable, suggesting ongoing strength in the prevailing trend.
Also read: Rectangle Patterns Decoded: A Must-Have Tool for Crypto Price Action Traders
4. Simple Way to Identify A Price Action Divergence
Identifying price action divergence, whether bullish or bearish, involves a step-by-step process.
- Bullish Divergence
- If the price hits a lower low, connect the two bottoms with a line.
- Next, assess the technical indicator; if it fails to reach a lower low, a bullish divergence is indicated.
This signals a potential reversal as the downward momentum weakens, suggesting an upcoming upward shift.
- Bearish Divergence
- Observe whether the price has attained a higher high.
- Connect the two tops with a line and check if the technical indicator fails to reach a higher high. If failed, it indicates weakening upward momentum and potential downward reversal.
Also Read: How to Trade Cryptocurrencies? A Step-by-Step Guide to Buying and Selling Crypto
5. Five Best Strategies to Trade Analysing Price Action Divergence
Here are the five prime strategies to trade analysing Price Action Divergence:
- Confirmation With Trendlines
Implement trendlines to validate price action divergence. Draw trendlines connecting successive highs or lows in price movements. Confirm divergence by ensuring the trendlines align with the direction indicated by the divergence, reinforcing the reliability of the trading signal.
- Multiple Time Frame Analysis
Employ multiple time frames for a comprehensive view of price action divergence. Identify divergence on both shorter and longer time frames to strengthen the reliability of signals. This strategy helps traders avoid false signals and enhances the overall accuracy of divergence-based trading decisions.
- Combining Divergence with Support/Resistance
Merge divergence analysis with support and resistance levels for robust trading strategies. When divergence aligns with key support or resistance zones, it adds confirmation to potential trend reversals or continuations, providing traders with well-rounded insights for more effective decision-making in crypto trading.
- Volume Confirmation
Incorporate volume analysis to validate price action divergence. Confirm divergence signals by observing corresponding changes in trading volume. An increase in volume during a divergence enhances the signal’s reliability, indicating stronger market sentiment and increasing the probability of a successful trade. This strategy helps traders make more informed decisions by considering both price action and trading volume dynamics.
- Moving Average Convergence Divergence Crossovers
Use the MACD indicator to identify crossovers as a confirmation tool for divergence signals. When the MACD line crosses above the signal line after a bullish divergence or below the signal line following a bearish divergence, it reinforces the potential strength of the reversal or continuation indicated by the divergence.
Also Read: Price Action Divergence: A Crypto Trading Masterclass To Spot The Best Trading Opportunity
Endnote
Mastering the art of analysing price action divergence in cryptocurrency trading requires a nuanced understanding of price momentum and effective use of momentum indicators like RSI, Stochastics and ROC. Divergence, whether bullish, bearish, or hidden, serves as a crucial indicator for potential market shifts. The article outlines a step-by-step process for identifying divergence and presents five key strategies for trading based on these signals. By incorporating trendlines, multiple time frame analysis, support/resistance levels, volume confirmation, and MACD crossovers, crypto traders can enhance the reliability of their divergence-based decisions. With careful application of these strategies, cryptocurrency traders can navigate the dynamic market landscape with greater precision and confidence.
We'd Love to Hear Your Thoughts on This Article!
Was this writing helpful?
 Yes No
Trust with CoinPedia:
CoinPedia has been delivering accurate and timely cryptocurrency and blockchain updates since 2017. All content is created by our expert panel of analysts and journalists, following strict Editorial Guidelines based on E-E-A-T (Experience, Expertise, Authoritativeness, Trustworthiness). Every article is fact-checked against reputable sources to ensure accuracy, transparency, and reliability. Our review policy guarantees unbiased evaluations when recommending exchanges, platforms, or tools. We strive to provide timely updates about everything crypto & blockchain, right from startups to industry majors.
Investment Disclaimer:
All opinions and insights shared represent the author's own views on current market conditions. Please do your own research before making investment decisions. Neither the writer nor the publication assumes responsibility for your financial choices.
Sponsored and Advertisements:
Sponsored content and affiliate links may appear on our site. Advertisements are marked clearly, and our editorial content remains entirely independent from our ad partners.


