How to Use Double Tops & Bottoms for Smarter Trading Decisions
Qadir Ak is the founder of Coinpedia. He has over a decade of experience writing about technology and has been covering the blockchain and cryptocurrency space since 2010. He has also interviewed a few prominent experts within the cryptocurrency space.

Imagine you’re looking at a price chart, and you notice a pattern forming—something that looks like a mountain or a valley. What if I told you that these shapes could give you a serious trading edge? That’s where double tops and double bottoms come in. These patterns are like road signs telling you what might happen next in the market.
If you’ve ever struggled to figure out when to enter or exit a trade, this guide is for you. We’ll break down these two patterns, explain how to spot them, and, most importantly, show you how to use them to make better trading decisions. Let’s dive in!
What Are Double Tops and Double Bottoms?
Double tops and double bottoms are reversal patterns that signal a potential change in trend. Think of them as the market trying something twice and failing, which hints that the price might head in the opposite direction.
- A double top forms after an uptrend and suggests a bearish reversal (price is likely to go down).
- A double bottom appears after a downtrend and hints at a bullish reversal (price is likely to go up).
These patterns are common and reliable if identified correctly. But the key is knowing how to confirm them before making your move.

Double Top: Spotting a Market Peak
A double top looks like the letter “M” on a chart. Here’s how it forms:
- The price moves up and reaches a peak.
- It pulls back slightly, forming a short dip.
- The price climbs again but struggles to break the first peak.
- Failing to go higher, it drops below the previous low. That’s when a bearish reversal is confirmed.
Why Does a Double Top Happen?
Think of it like someone trying to jump over a wall. They try once and almost make it. They try again but still fail. Eventually, they give up and move in the opposite direction. That’s what’s happening with price action—buyers push the price up, but they can’t sustain it, so sellers take over.
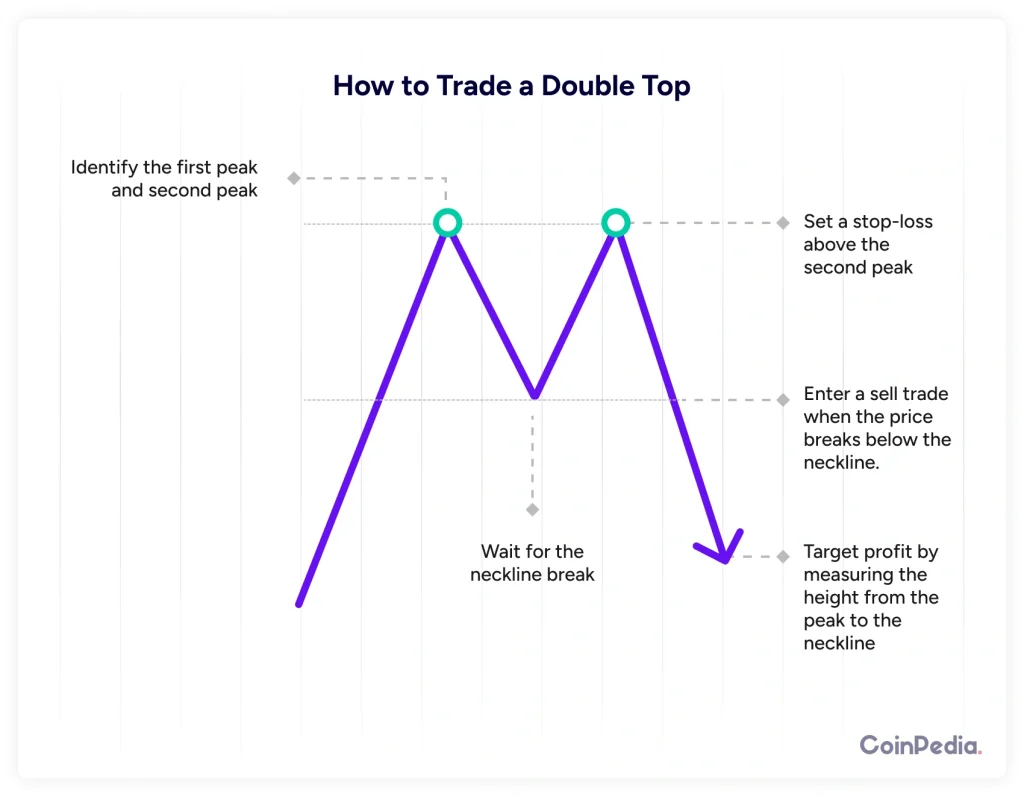
How to Trade a Double Top
- Identify the first peak and second peak – They should be roughly at the same level.
- Wait for the neckline break – The neckline is the support level formed at the low between the two peaks.
- Enter a sell trade when the price breaks below the neckline.
- Set a stop-loss above the second peak to manage risk.
- Target profit – Measure the height from the peak to the neckline and use that distance as your expected downward move.
Example of a Double Top
Let’s say Bitcoin is trading at $50,000. It peaks at $55,000, drops to $52,000, then tries to climb back to $55,000 but fails. Once it falls below $52,000, it confirms the double top, and the price might head lower.
Double Bottom: Spotting a Market Bottom
A double bottom is the opposite of a double top. It looks like the letter “W” and forms after a downtrend. Here’s how it happens:
- The price drops and hits a low.
- It rebounds slightly but falls back again.
- It retests the previous low but doesn’t break lower.
- Once it rises above the neckline, a bullish reversal is confirmed.
Why Does a Double Bottom Happen?
Imagine you’re bouncing a basketball. If you drop it and it bounces back twice at the same level before shooting up, that’s exactly how a double bottom works. Sellers push the price down twice, but buyers step in strongly, preventing further decline.
How to Trade a Double Bottom
- Identify the two lows – They should be at roughly the same level.
- Wait for a breakout above the neckline (the highest point between the two lows).
- Enter a buy trade when the price breaks above the neckline.
- Set a stop-loss below the second low to control risk.
- Target profit – Measure the distance from the low to the neckline and use that as your expected upward move.
Example of a Double Bottom
Imagine Ethereum is in a downtrend and falls to $1,500. It bounces to $1,700, drops back to $1,500, but doesn’t go lower. Once it breaks above $1,700, it confirms a double bottom, and the price is likely to rise.
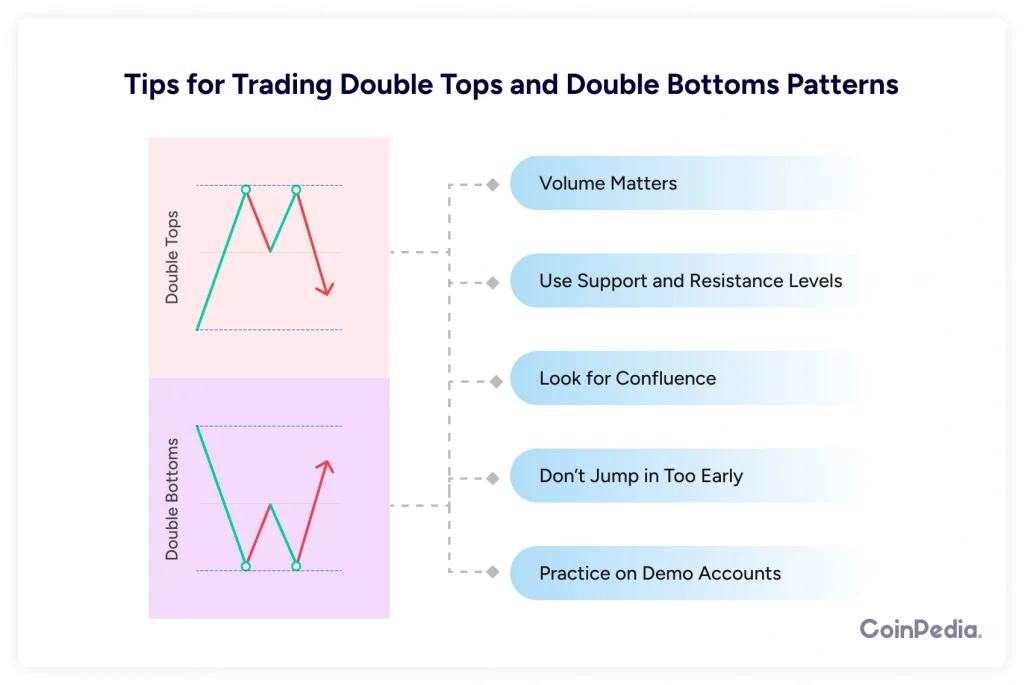
Tips for Trading These Patterns Successfully
- Volume Matters – Watch for increased volume when the neckline breaks. More volume means stronger confirmation.
- Use Support and Resistance Levels – These patterns work best when they form near key support and resistance zones.
- Look for Confluence – If other indicators (like RSI or MACD) confirm the reversal, your trade setup is stronger.
- Don’t Jump in Too Early – Wait for a clear breakout to avoid false signals.
Practice on Demo Accounts – Before using real money, test these patterns on demo trades.
Common Mistakes to Avoid
- Misidentifying Patterns – Not every peak and valley is a double top or bottom. Make sure they’re well-formed.
- Ignoring Market Context – These patterns work best in trending markets. Avoid them in choppy or sideways markets.
- Forgetting Stop-Losses – Always use stop-losses to protect your capital.
- Trading Without Confirmation – If the neckline isn’t broken, the pattern isn’t confirmed.
Final Thoughts
Double tops and double bottoms are powerful patterns that can help you spot trend reversals. But like any strategy, they work best when combined with other tools and proper risk management. The next time you see an “M” or “W” on your chart, you’ll know exactly what to do!
Also read: The Psychology Behind Crypto Trading: A Simple Introduction
Want to practice? Pull up your favorite trading platform and start spotting these patterns in historical charts. The more you train your eye, the better you’ll get at catching high-probability setups.
Also read: Mind Over Market: Conquering Emotional Bias in Crypto Trading
FAQs
A double top is a bearish reversal pattern where the price forms two peaks at similar levels before declining below a key support level.
A double bottom is a bullish reversal pattern where the price hits a low twice before breaking above resistance, signaling a potential uptrend.
Confirmation happens when the price breaks the neckline with strong volume, supported by other indicators like RSI or MACD.
Yes, false breakouts occur. Always confirm with volume, trend strength, and other technical indicators before entering a trade.
Well Done! You have now completed the Lesson.
Complete the Quiz and Get Certified! All The Best!
Was this writing helpful?
Disclaimer and Risk Warning
The information provided in this content by Coinpedia Academy is for general knowledge and educational purpose only. It is not financial, professional or legal advice, and does not endorse any specific product or service. The organization is not responsible for any losses you may experience. And, Creators own the copyright for images and videos used. If you find any of the contents published inappropriate, please feel free to inform us.