- Yash Jain
 Yash Jain
- Reviewed by:
 Qadir AK
Qadir Ak is the founder of Coinpedia. He has over a decade of experience writing about technology and has been covering the blockchain and cryptocurrency space since 2010. He has also interviewed a few prominent experts within the cryptocurrency space.
- Jan 13, 2026 12:35 UTC
-
Exclusive! Coinpedia’s 2025 Crypto Report Reveals Market Prices, ETF Growth, Hacks & Funding
Table of contents
- 1. Executive Summary
- 2. Macro & Regulatory Landscape
- 3. Global Crypto Market Overview
- 4. Bitcoin Market Analysis
- 2025 Market Context: Institutional Success, Price Frustration
- Macro Shock: Trade Wars, Volatility, and Safe-Haven Rotation
- Is the Four-Year Cycle Broken?
- Volatility Compression and Asset Maturation
- Onchain Activity: Who Is Selling, Who Is Holding
- Why Falling Hash Rate Can Be Bullish
- Exchange Balances and Self-Custody Trends
- Bitcoin ETFs: Institutionalization Accelerates
- Ethereum ETFs: Adoption with Constraints
- Bitcoin’s Evolving Narrative
- 5. Spot & Derivatives Crypto ETFs
- 6. DeFi: On-Chain Finance in 2025
- 7. Stablecoins and On-Chain Payments
- 8. Crypto Fundraising: 1,179 Rounds in 2025
- 9. Global Crypto Adoption in 2025
- 10. NFTs, Gaming, and Digital Ownership
- 11. Security, Hacks, and Crypto Crime
- 12. 2026 Outlook: Scenarios and Catalysts
- 13. Investment Implications & Asset Class Winners (2026)
- Strategic Implications for 2026
1. Executive Summary
Key Themes of 2025
The year 2025 marked a structural transition for the crypto industry. Unlike prior cycles dominated by speculative excess, this period was defined by institutional integration, regulatory normalization, and infrastructure maturity. Major global asset managers, including BlackRock, Franklin Templeton, Grayscale, VanEck, Bitwise, and 21Shares, converged on a common thesis: crypto is increasingly driven by portfolio allocation, payments utility, and on-chain financial infrastructure, rather than retail-led boom-and-bust behavior.
Across institutional outlooks, digital assets were no longer framed as fringe alternatives but as parallel financial infrastructure increasingly embedded within the global financial system.
- Three dominant themes defined 2025:
- Bitcoin’s institutionalization via ETFs, creating regulated and scalable exposure
- Stablecoins are emerging as global financial rails for payments and settlement
- AI-enabled, agentic on-chain systems, signaling early-stage automation of financial activity
Market State vs Previous Cycles
The 2025 market cycle differed materially from prior boom-bust patterns such as 2017 and 2021.
Key structural differences observed in 2025:
- Lower volatility compression in Bitcoin
- A higher proportion of long-term holders
- Persistent institutional inflows via spot Bitcoin ETFs
- Stronger volatility-adjusted returns, though less explosive upside
Grayscale and Bitwise both emphasized that while price appreciation was more measured, risk-adjusted performance improved meaningfully, reflecting maturity rather than speculative frenzy.
Crypto’s Role in the Global Financial System
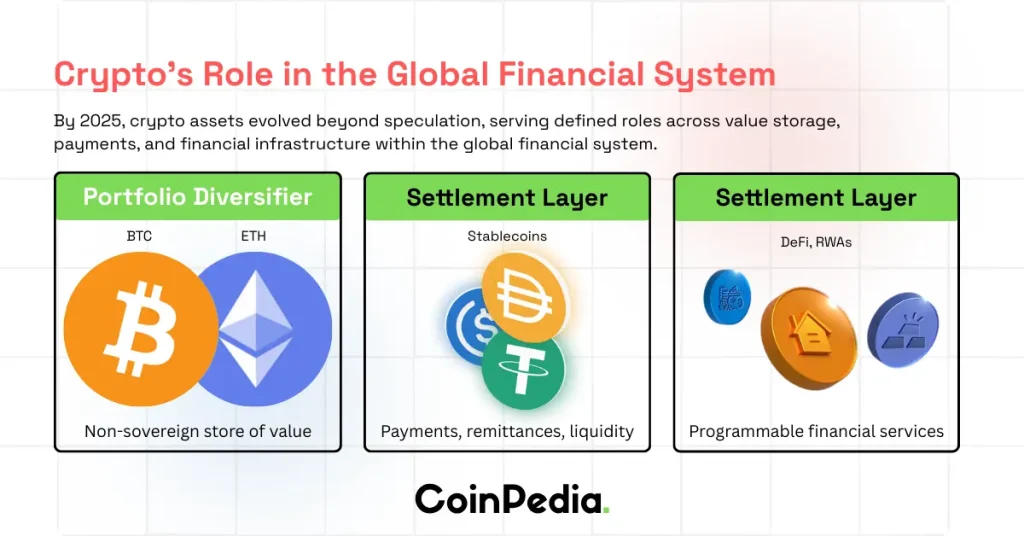
By the end of 2025, crypto assets increasingly serve distinct functional roles within the global financial architecture.
| Function | Asset Class | Role |
| Portfolio Diversifier | Bitcoin, Ethereum | Non-sovereign store of value |
| Settlement Layer | Stablecoins | Payments, remittances, liquidity |
| Financial Infrastructure | DeFi, RWAs | Programmable financial services |
BlackRock explicitly framed digital assets as “a parallel financial technology stack rather than an alternative asset class,” reinforcing their integration into traditional finance.
2. Macro & Regulatory Landscape
Global Macro Environment and Liquidity
The macro backdrop of 2025 was shaped by elevated uncertainty and gradual monetary transitions.
Key macro conditions included:
- Expectations of gradual monetary easing across major economies
(U.S. policy rates at 3.50–3.75%, India at 5.25%, U.K. at 3.75%) - Rising sovereign debt burdens, with U.S. debt exceeding $37.6 trillion
- Persistent geopolitical fragmentation, including trade conflicts and armed tensions
Against this backdrop, Bitcoin’s appeal strengthened as a non-sovereign, supply-capped asset, propelling it toward $126,000. Narratives such as “digital gold,” “hedge against inflation,” and “fix the money” gained renewed traction.
Key Regulatory Developments by Region
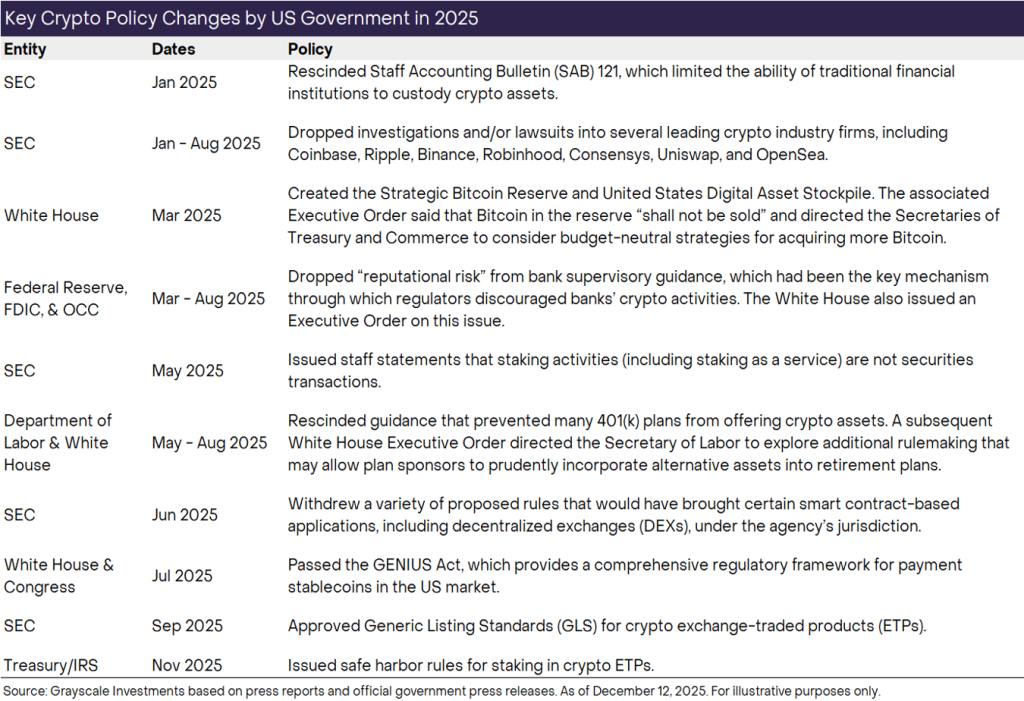
United States
The U.S. regulatory environment remained enforcement-heavy but structurally clearer by year-end.
Major developments included:
- Approval and expansion of spot Bitcoin ETFs
- Appointment of Paul Atkins as SEC Chair
- Dismissal of major SEC lawsuits against Coinbase and Binance
- Formation of a dedicated SEC Crypto Task Force
Key legislation:
- GENIUS Act: Established the first federal stablecoin framework, mandating 100% reserve backing and transparency.
- CLARITY Act: Advanced through Congress to delineate oversight between the SEC and CFTC.
Banking regulators (FDIC, OCC, Federal Reserve) reversed prior restrictive stances, enabling banks to engage in custody, trading, and stablecoin issuance.
European Union
The implementation of MiCA brought licensing clarity across the bloc.
Key impacts:
- Mandatory 100% reserve backing for EMTs and ARTs
- Strict audit, governance, AML, and KYC requirements
- Growth of compliant EUR-denominated stablecoins
- Higher institutional participation on regulated platforms
However, increased compliance costs pressured smaller startups, prompting some to consider relocating outside the EU.
Asia (Japan, Singapore, India, South Korea)
Asia continued to adopt divergent regulatory approaches.
- Japan approved its first JPY-pegged stablecoin and strengthened compliance frameworks
- Singapore operationalized Project Guardian for tokenized funds
- India maintained restrictive taxation (30% flat tax, no loss offsets), suppressing retail participation
- South Korea enforced the Virtual Asset User Protection Act (VAUPA) and advanced draft legislation under the Digital Asset Basic Act (DABA)
Middle East & Africa
The Middle East emerged as an institutional crypto hub.
Notable developments:
- UAE’s Federal Decree-Law No. 6 formally split oversight between monetary and investment assets.
- Dubai’s VARA introduced Asset-Referenced Virtual Assets (ARVAs) for RWAs.
- Full VAT exemption on crypto transactions in late 2025
In Africa
- South Africa enforced FATF Travel Rule compliance
- Saudi Arabia expanded its SAMA Regulatory Sandbox
- Nigeria refined its crypto exchange registration under SEC oversight.
Latin America
- Crypto adoption accelerated amid inflation and currency instability.
- Brazil finalized VASP licensing and advanced the DREX Digital Real
- Argentina legally recognized stablecoin-denominated contracts
- El Salvador expanded tokenized securities issuance under the Digital Assets Law
- Colombia exited its regulatory sandbox with permanent banking-crypto integration
Taxation, Compliance, and Enforcement Trends
- Taxation and Reporting
- A shift toward formalized global reporting frameworks became dominant.
- OECD CARF & EU DAC8 enabled cross-border crypto data exchange
- IRS Form 1099-DA mandated cost-basis reporting for U.S. taxpayers
- Global tax authorities increased audit activity.
Blockchain Analytics and Enforcement
- AI-powered tracing became standard for law enforcement
- Enhanced monitoring across bridges and interoperability layers
- Increased DeFi surveillance targeting identifiable control points
Sanctions enforcement intensified, with coordinated G7 actions and high-profile seizures linked to sanctions evasion.
Policy Outlook for 2026 and Beyond
Looking ahead, institutional consensus points toward incremental legalization rather than deregulation.
Key expectations include:
- Prioritization of stablecoins and RWAs
- Convergence around global standards (MiCA, GENIUS Act)
- Transition from framework-building to active supervision
- Increased enforcement against non-compliant entities
Bitwise anticipates the passage of U.S. market structure legislation via the CLARITY Act, providing long-term regulatory certainty over SEC vs CFTC oversight.
3. Global Crypto Market Overview
Total Market Capitalization & Liquidity Trends
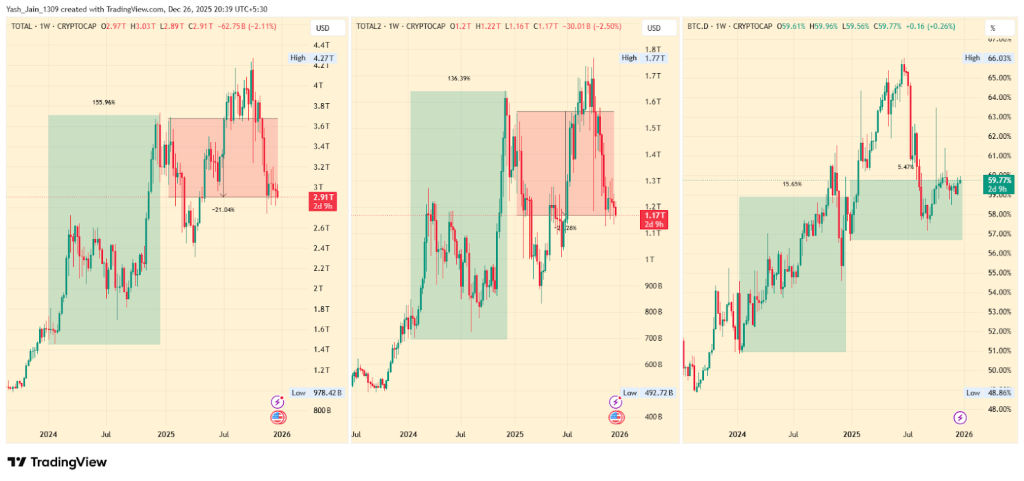
The global crypto market in 2025 experienced uneven growth, characterized by strong headline rallies driven primarily by Bitcoin and stablecoins, rather than broad-based altcoin expansion. Liquidity conditions, regulatory clarity, and institutional participation shaped capital flows more than speculative retail activity.
Market Capitalization Timeline (Key Milestones)
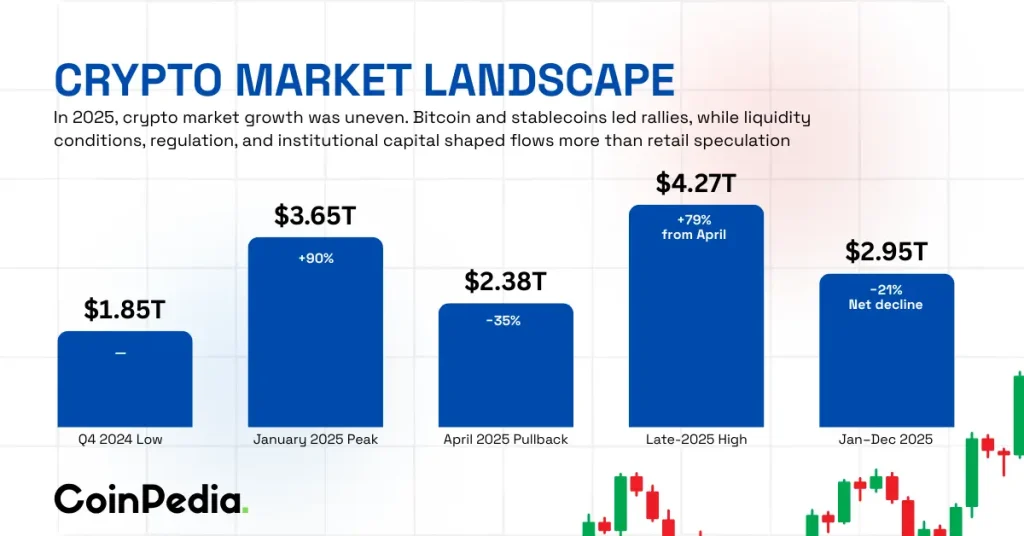
| Period | Total Market Cap | Change |
| Q4 2024 Low | $1.85T | – |
| Jan 2025 Peak | $3.65T | +90% |
| Apr 2025 Pullback | $2.38T | -35% |
| Late-2025 High | $4.27T | +79% from Apr |
| Jan–Dec 2025 | $2.95T | -21% net decline |
Despite headline highs, the net expansion from January to December 2025 remained muted, reinforcing the view that capital rotated rather than structurally expanded.

Liquidity & Structural Shifts
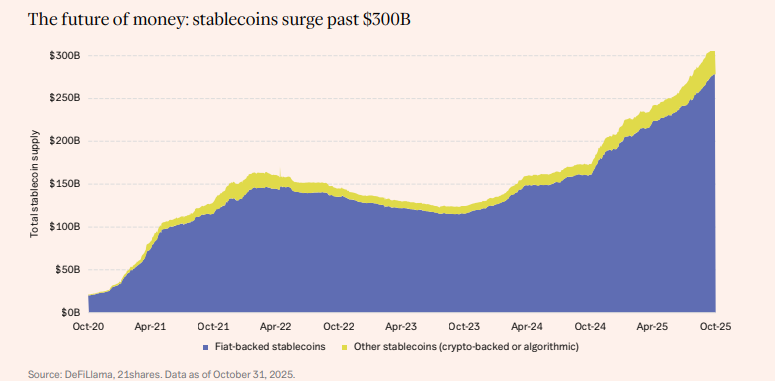
- Stablecoin supply grew to $295–300B, increasingly used for remittances and capital preservation during volatility
- Liquidity migrated from offshore exchanges toward regulated onshore venues (CME, EU/US exchanges)
- OTC desks recorded record institutional block trade volumes
- DeFi liquidity stagnated or declined following hacks and regulatory preference for CeFi rails
- Spot BTC & ETH ETFs introduced deep, regulated liquidity pools, stabilizing market drawdowns
- Bid-ask spreads tightened significantly for BTC/ETH but widened for illiquid altcoins
Bitcoin Dominance vs Altcoin Market Share
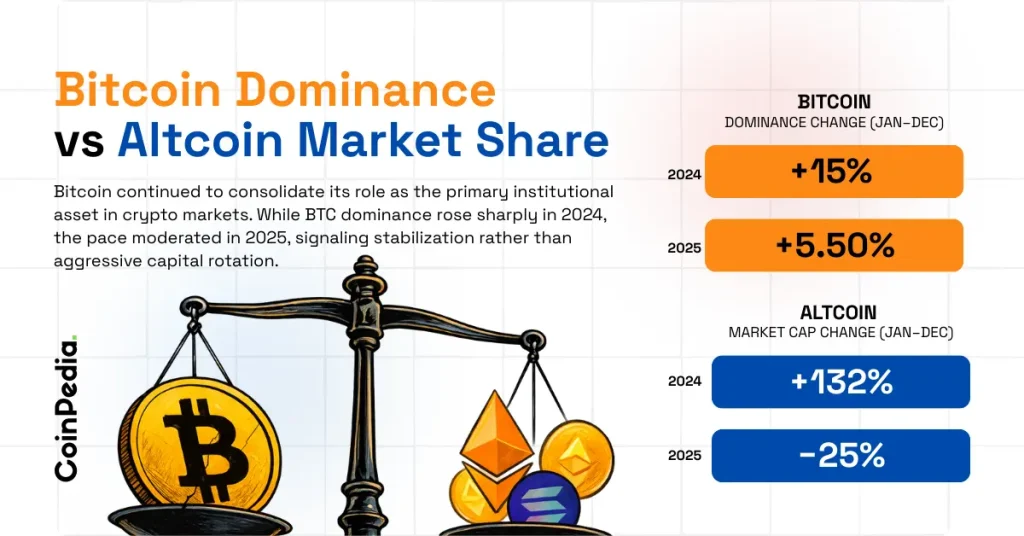
Bitcoin continued to consolidate its role as the primary institutional asset in crypto markets. While BTC dominance rose sharply in 2024, the pace moderated in 2025, signaling stabilization rather than aggressive capital rotation.
Dominance & Performance Metrics
- BTC dominance increase (Jan–Dec 2025): +5.5%
- BTC dominance increase (Jan–Dec 2024): +15%
- Altcoin market cap change (Jan–Dec 2025): -25%
- Altcoin market cap change (Jan–Dec 2024): +132%
Institutional capital remained concentrated in BTC and ETH, reinforcing a persistent flight-to-quality narrative.
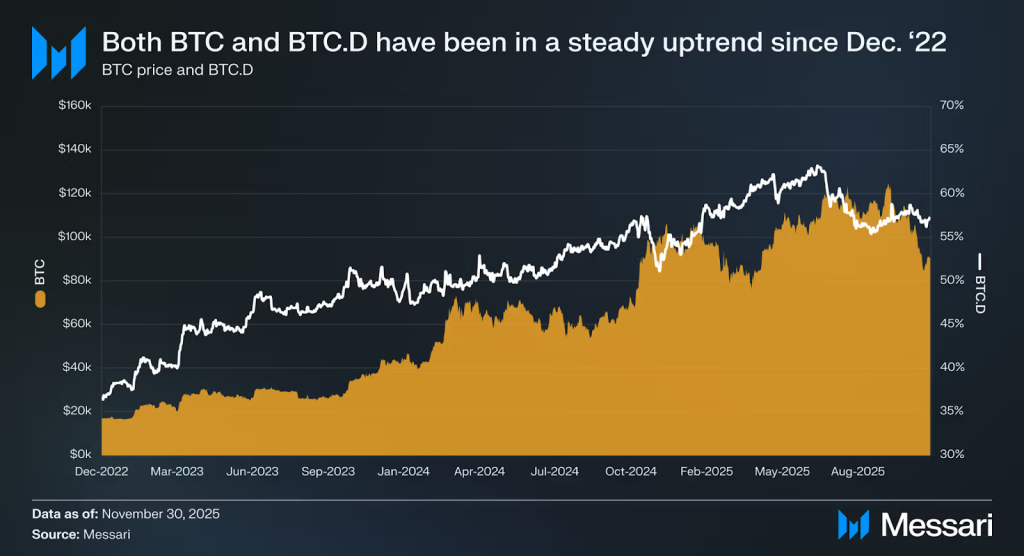
Bitcoin Long-Term Performance
- Dec 2022 price: $17,200
- Oct 6, 2025 ATH: $126,200
- Dec 2025 price range: $90,400
- Total rally since Dec 2022: +429%
Sector-Wise Performance
Layer 1s & Layer 2s
Ethereum’s scaling ecosystem entered a decisive consolidation phase in 2025. While over 50 rollups competed for activity, usage and liquidity concentrated sharply.
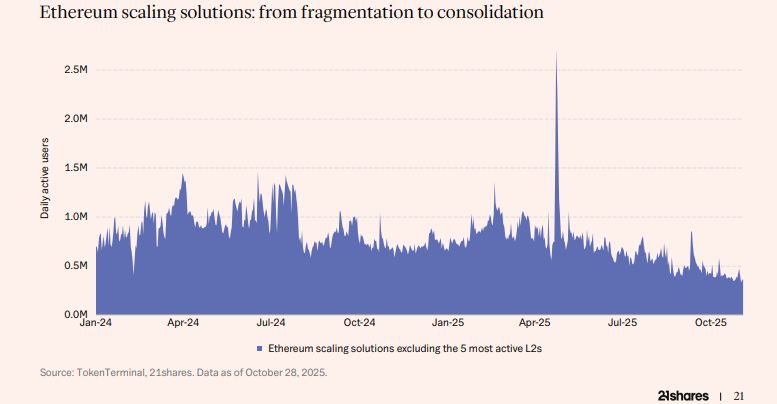
L2 Market Structure
- Base, Arbitrum, and Optimism processed 90% of all L2 transactions
- Base alone exceeded 60% market share
- L2 activity declined 61% since June
Ecosystem Stress & Consolidation
- Kinto shut down
- Loopring ended wallet services
- Blast TVL collapsed 97%
- Aave and Synthetix reduced L2 deployments due to weak liquidity
The Dencun upgrade reduced fees by 90%, triggering fee wars and margin compression. Only Base achieved profitability, generating $55M in annual revenue.
Emerging Alternatives
- Appchains and high-performance platforms (e.g., Hyperliquid) absorbed migrating liquidity
- ETH-aligned designs (Linea, MegaETH) aim to re-anchor value capture to Ethereum
- Specialized networks (Lighter, Tempo) demonstrated sustainability through focused use cases
Centralized exchange-backed chains (Base, BSC, Mantle, Ink) increasingly dominated user onboarding, highlighting the distribution advantage of Web2 incumbents.
Decentralized Finance (DeFi)
DeFi advanced further into maturity in 2025, marked by institutional participation, clearer credit cycles, and improved product-market fit.
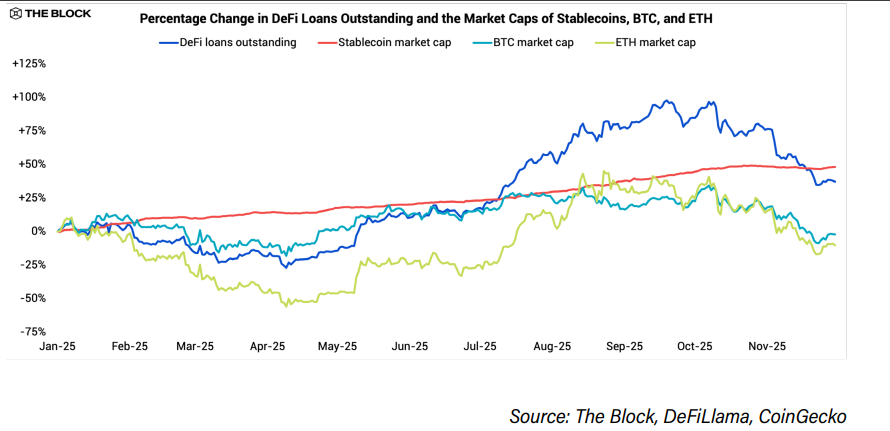
Key Structural Trends
- Growth in stablecoins and tokenized assets
- Expansion of DeFi lending and private credit
- ATH volumes on perpetual DEXs
- Muted spot DEX growth driven by chain rotation
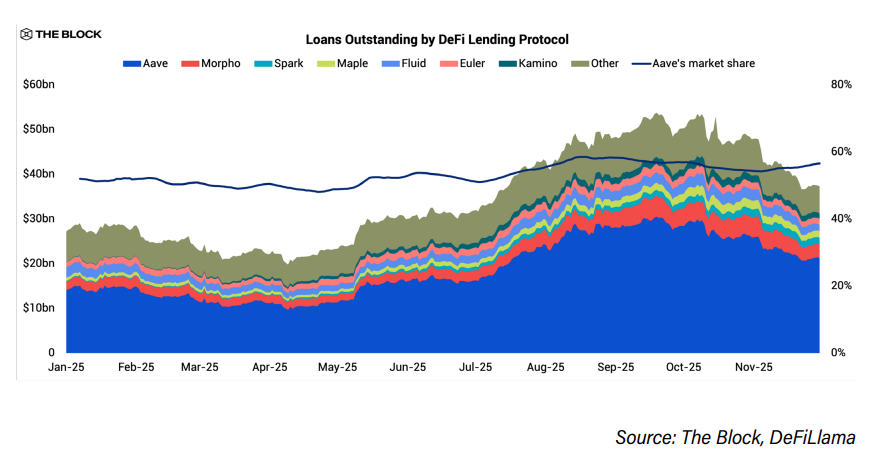
Lending Market Leaders
| Protocol | Loans Outstanding (2025) | Key Drivers |
| Aave | 56.5% share of total debt | Deep ETH liquidity, multichain expansion |
| Morpho | $3.0B | Coinbase integration, Base dominance |
| Maple | $1.5B | Tokenized private credit, SyrupUSD |
Aave expanded through Plasma and Linea integrations, while Morpho leveraged Coinbase distribution. Maple emerged as the fastest-growing lender by packaging institutional private credit into liquid, composable tokens.
DeFi in 2025 demonstrated durable equilibrium dynamics, laying the foundations for sustained institutional alignment.
Real-World Assets (RWAs)
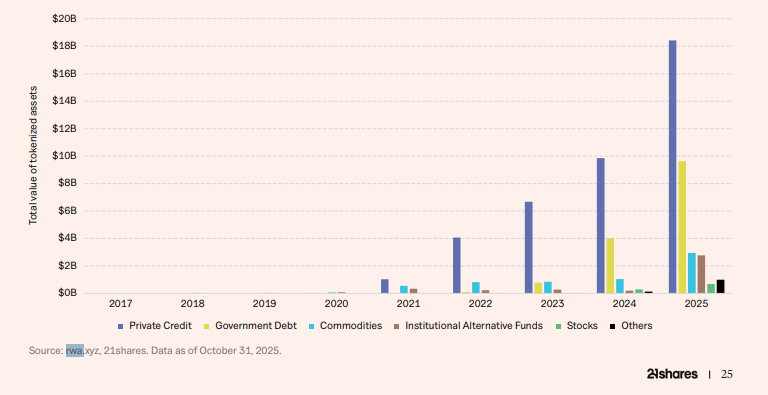
2025 marked the breakout year for RWA tokenization, transitioning from experimentation to institutional-scale adoption.
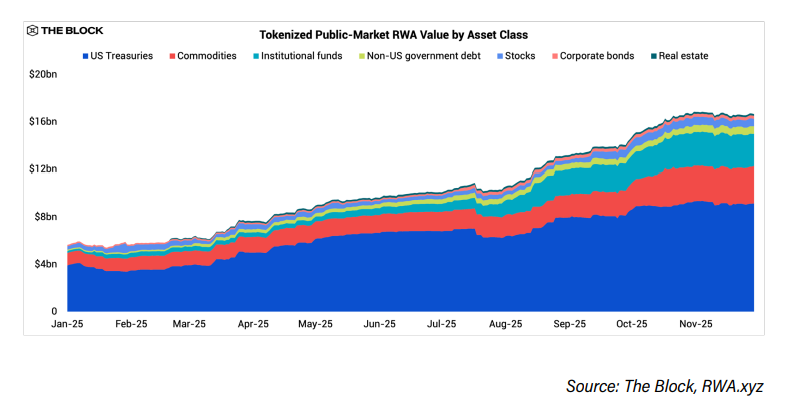
RWA Market Growth (YTD)
| Category | Start | End |
| Total Tokenized RWAs | $5.6B | $16.7B |
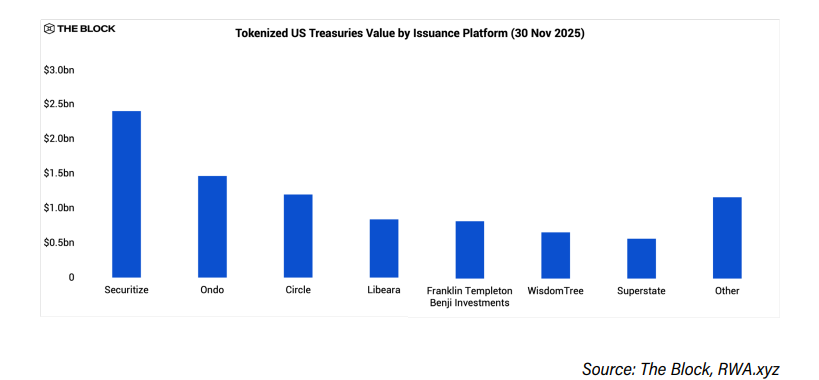
| US Treasuries | $3.9B | $9.2B |
| Commodities | $1.1B | $3.1B |
| Institutional Funds | $170M | $2.7B |
BlackRock’s BUIDL ($2.3B AUM) emerged as core on-chain collateral, underpinning products from Ethena and Ondo. Tokenized gold (XAUT, PAXG) surged alongside gold’s +60.7% YTD performance.
Tokenization proved its value as a distribution technology, integrating seamlessly with DeFi lending, treasury, and yield strategies.
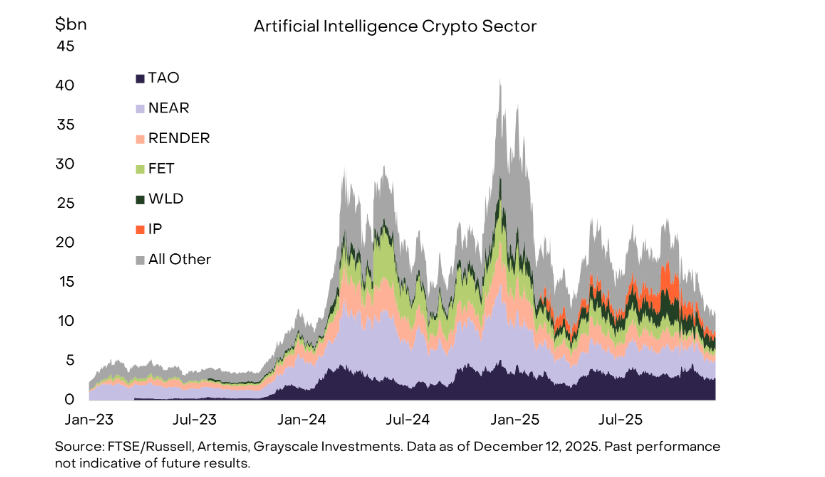
AI × Crypto Convergence
The convergence of AI and crypto emerged as a structural investment theme in 2025, driven by agent-based systems, decentralized compute, and programmable finance.

Key Developments
- Nearly $1B in venture funding into decentralized AI networks
- AI agents enabling autonomous portfolio management and DeFi execution
- Crypto rails providing trustless settlement, identity, and payments
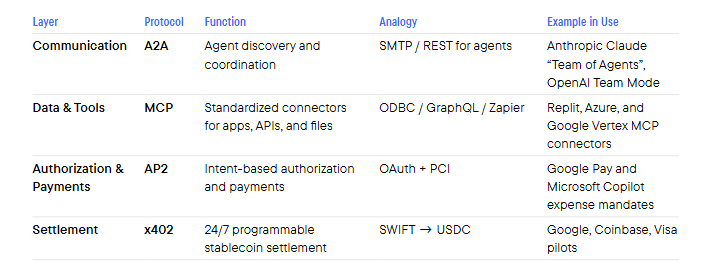
Protocols such as Bittensor, World, Story Protocol, and Eigen Cloud addressed trust, provenance, and compute challenges. Payment standards like x402 and agent identity frameworks enabled machine-to-machine economies.
If even 1% of global fund assets adopt agentic strategies, this represents $1T+ in AI-managed capital.
Top Performers & Underperformers (Top 100)
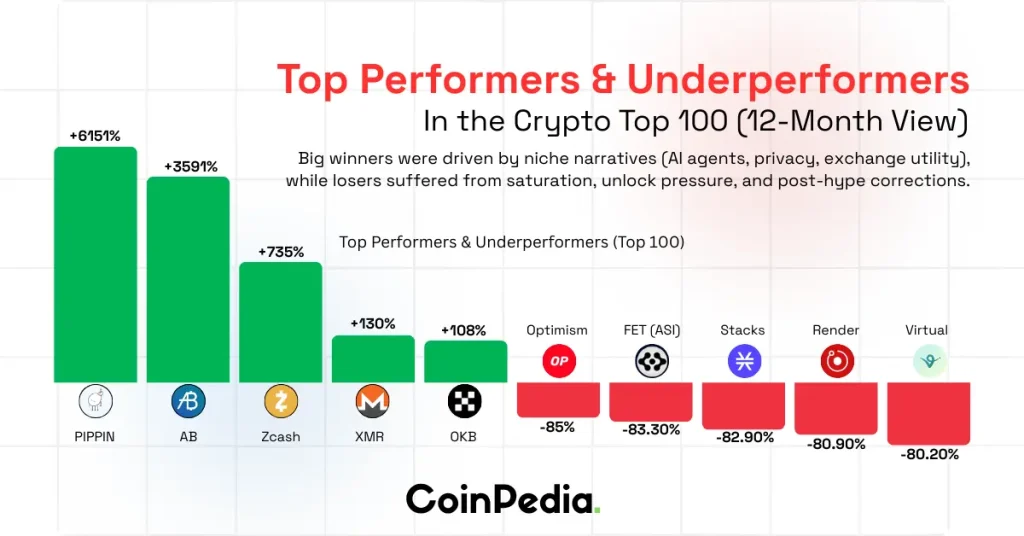
| Rank | Asset Name | Performance (12M) | Category / Primary Driver |
| Top Performer | PIPPIN | +6,151% | AI-Agent Memecoin (Solana) |
| Top Performer | AB (Newton) | +3,591% | Ecosystem Utility / Stablecoin Integration |
| Top Performer | ZEC (Zcash) | +735% | Privacy Sector Re-rating / NU 6.1 Upgrade |
| Top Performer | XMR (Monero) | +130% | Default Anonymity / Defensive Positioning |
| Top Performer | OKB | +108% | Exchange Utility (OKX Ecosystem) |
| Worst Performer | Optimism (OP) | -85.0% | Layer 2 Saturation / Token Unlocks |
| Worst Performer | FET (ASI) | -83.3% | AI Infrastructure Correction |
| Worst Performer | STX (Stacks) | -82.9% | Bitcoin L2 Exhaustion |
| Worst Performer | Render (RNDR) | -80.9% | DePIN / Compute Sector Profit-Taking |
| Worst Performer | Virtual | -80.2% | Virtual Protocol / Metaverse Fatigue |
CEX vs DEX Volume & Market Share
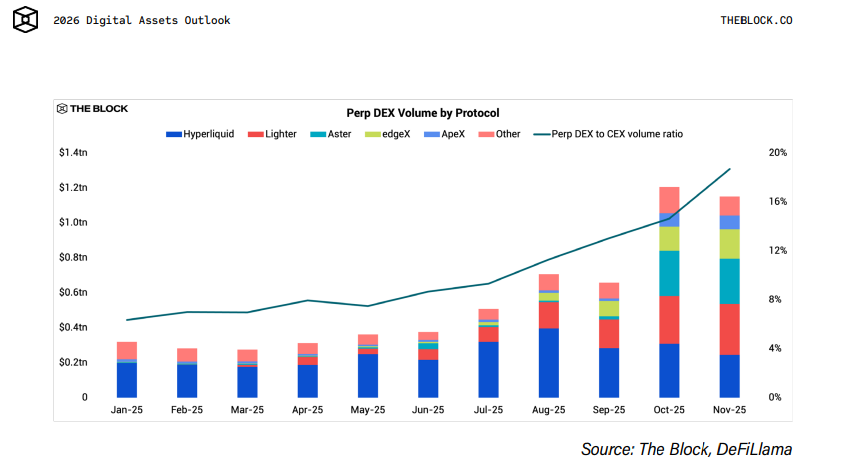
2025 marked a structural inflection point for on-chain derivatives.
2025 marked a structural inflection point for on-chain derivatives.
Perpetual Futures Market Share
- DEX-to-CEX ratio rose from 6.3% → 18.7%
- October recorded ATH on-chain derivatives volume
Perp DEX Leaders
- Hyperliquid: $3.0T annualized volume
- Lighter: Zero-fee model, Robinhood strategic investment
- Aster: Binance-aligned, lower fees, strong distribution
Competition intensified, narrowing the efficiency gap with centralized venues.
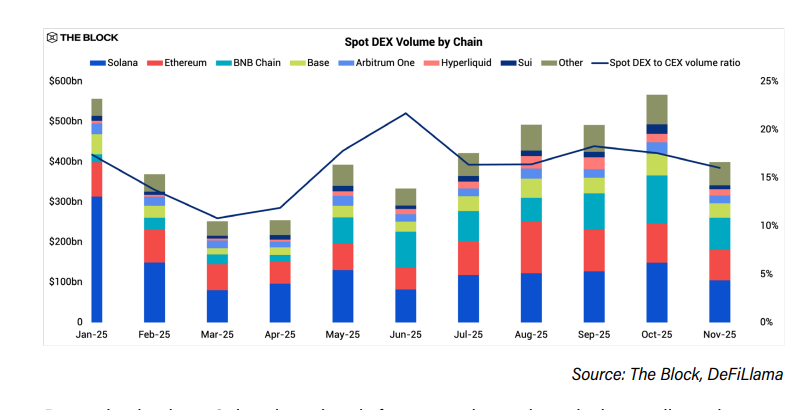
Spot DEX Dynamics
- Solana spot volume: -66.7% (Jan–Nov)
- BNB Chain spot volume: +4x growth
- DEX/CEX spot ratio remained below 20%
Retail speculation rotated rather than disappeared, reinforcing the maturity of spot DEX infrastructure.
4. Bitcoin Market Analysis
2025 Market Context: Institutional Success, Price Frustration
The global crypto market reached an all-time high of $4.3 trillion in 2025, driven primarily by Bitcoin and Ethereum. Yet price action told a more complex story. Despite landmark institutional adoption and improving regulatory clarity, crypto prices remained largely range-bound, with few sectors sustaining momentum. Even President Donald Trump’s pro-crypto stance and commitment to making the U.S. a “Bitcoin superpower” failed to prevent Bitcoin from ending the year lower, while Ethereum only marginally exceeded its prior cycle peak.
2025 became a year of contradiction: structural legitimacy versus cyclical stagnation.
Macro Shock: Trade Wars, Volatility, and Safe-Haven Rotation
Following Trump’s inauguration as the 47th U.S. president, markets were shaken by the April 2, 2025 tariff announcement—”Liberation Day.” The policy imposed baseline tariffs of 10% on nearly all imports, with targeted tariffs exceeding 100%, the most aggressive trade action since World War II.
Markets reacted sharply:
- Equities and crypto sold off simultaneously
- Treasury yields spiked on instability fears
- Gold surged to historic highs
Bitcoin notably failed to act as digital gold during this shock, reinforcing its evolving identity as an institutional risk asset rather than a geopolitical hedge.
Is the Four-Year Cycle Broken?
Technical indicators suggest Bitcoin peaked near $126,000, reinforcing concerns that 2026 should historically be a corrective year. However, the traditional drivers of crypto cycles – halvings, rate cycles, and speculative leverage, which have weakened materially.
Instead, spot Bitcoin ETF approval in 2024 marked the start of a structural capital shift. Into 2026, allocations from Morgan Stanley, Wells Fargo, Merrill Lynch, and large wealth managers are expected to scale meaningfully. The post-2024 regulatory pivot further enables Wall Street and fintech firms to engage crypto markets with reduced friction.
Conclusion: Institutional demand is likely to outpace new supply, pushing Bitcoin beyond historical cycle constraints.
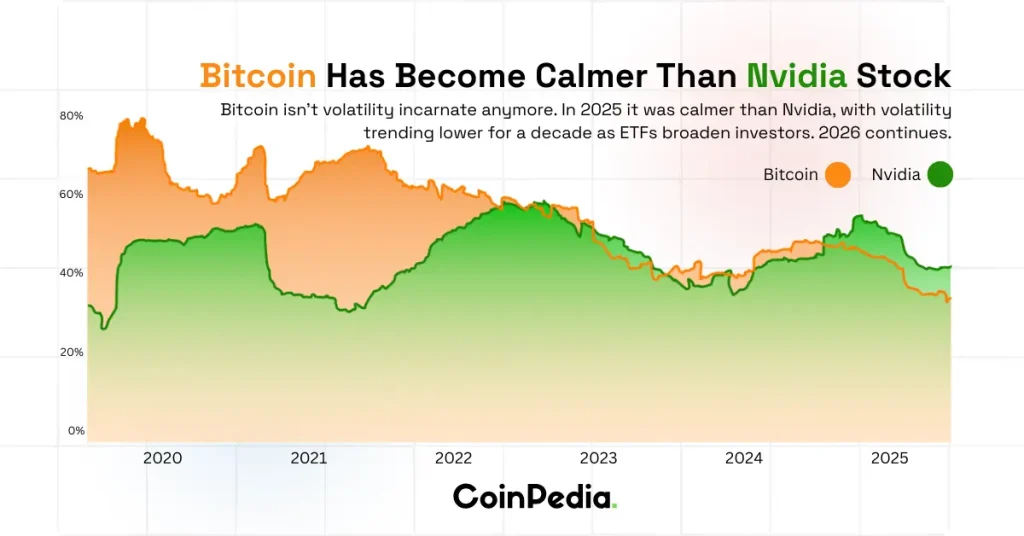
Volatility Compression and Asset Maturation
Bitcoin volatility continued its decade-long decline, falling below volatility levels seen in leading U.S. equities such as Nvidia. This compression reflects:
- Broader investor base
- ETF-driven capital stability
- Reduced reflexive leverage
Bitcoin is increasingly behaving like a macro financial asset rather than a speculative instrument.
Onchain Activity: Who Is Selling, Who Is Holding
Digital Asset Treasuries (DATs) aggressively bought the dip from mid-November to mid-December:
- +42k BTC (+4% m/m)
- Aggregate DAT holdings: 1.09m BTC
This was the largest accumulation since July–August 2025.
Token Age Dynamics:
- Medium-term holders (1–5 years) reduced balances sharply
- Oldest cohorts (>5 years) remained largely intact
This indicates cyclical players exiting while long-term conviction holders remain firm.
Miner Stress and Hash Rate Compression
- Bitcoin mining economics deteriorated in 2025:
- Hash rate CAGR since 2020: +62%
- Electricity breakeven fell from $0.12 to $0.077 (S19 XP)
- Network hash rate declined 4% (30D MA), which is the largest drop since April 2024

Up to 400k mining machines went offline amid profitability stress and a potential 10% hash rate removal from China as power shifted toward AI workloads.
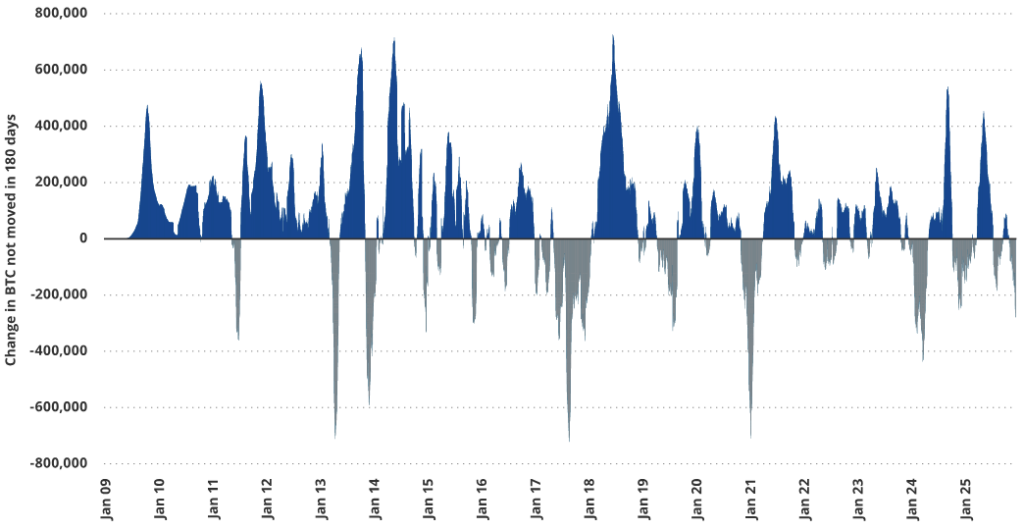
Why Falling Hash Rate Can Be Bullish
Historical data (since 2014):
- 180-day forward BTC returns were positive 77% of the time when hash rate growth was negative
- Average returns: +72% vs +48%
- Strategy outperformance: +2,400 bps
Hash rate compression has historically preceded periods of strong forward returns.
Exchange Balances and Self-Custody Trends
Exchange balances declined structurally, signaling a long-term holding behavior pattern for BTC & ETH.
- Bitcoin: 2.9m → 2.7m BTC in 2025
- Ethereum: 20.53m → 16.2m ETH

This shift toward self-custody signals long-term holding behavior and reduced sell-side pressure.
Bitcoin ETFs: Institutionalization Accelerates
By November 2025:
- Trading volume: $880B (+37% YoY)
- Net inflows: $16B
- AUM: $120B (+16%)
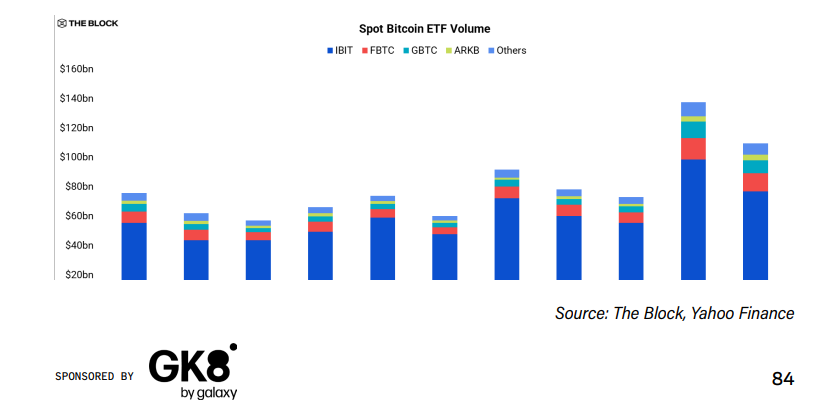
Issuer Breakdown:
- BlackRock IBIT: $70B AUM (59%)
- Fidelity FBTC: $17B
- Grayscale GBTC: $15.5B (continued outflows due to 1.5% fee)
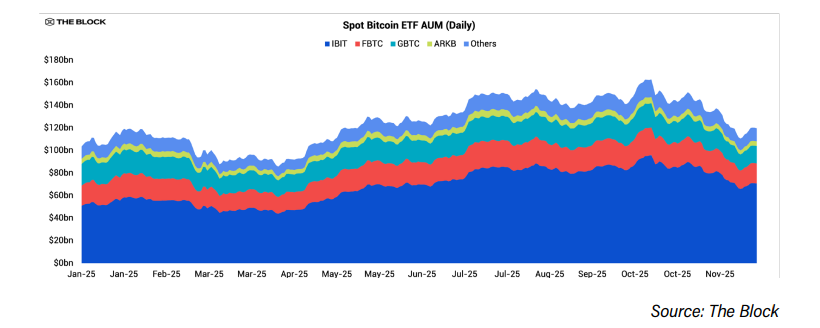
Institutional participation broadened beyond hedge funds. Harvard increased its IBIT holdings by 257% to $442.8M, making it its largest disclosed U.S. equity position.
Ethereum ETFs: Adoption with Constraints
Ethereum ETFs reached $277B in cumulative trading volume and +$6.2B YTD AUM growth.
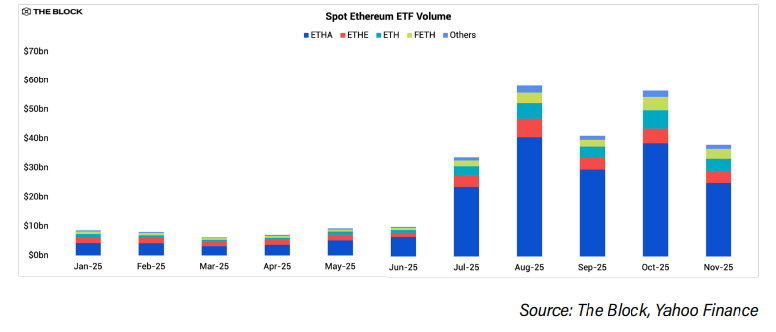
- BlackRock ETHA dominated with $11.1B AUM
- ETH ETFs averaged $1.2B daily volume, just 31% of Bitcoin ETFs
Lack of staking functionality remained a drag. Grayscale became the first to enable staking in October, but most ETH ETF holders still forgo 2.98% annual staking yield.

Bitcoin’s Evolving Narrative
By 2025, Bitcoin had fully transitioned into a:
- ETF-wrapped reserve asset
- Institutional treasury allocation
- Derisked portfolio component
With $120B in ETF AUM and 1.09m BTC held by DATs, Bitcoin became structurally embedded within global finance, even as it lagged gold during acute macro stress.
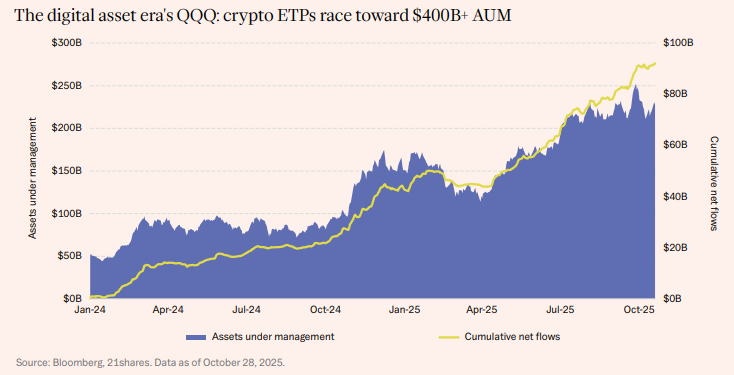
5. Spot & Derivatives Crypto ETFs
Bitcoin ETPs now hold over $140B, representing 7% of total supply, making them the largest single category of long-term holders.
Retail participation remains dominant:
- 73% retail / 27% institutional ownership of BTC ETP shares
- Enabled by broker access, IRAs, 401(k) eligibility, and low minimums
Regulatory breakthroughs accelerated product launches:
- Generic listing standards removed case-by-case SEC filings
- Solana ETFs (with staking) exceeded $600M inflows within months
- XRP, Dogecoin, and others followed
By late 2025, 120+ crypto ETP applications awaited review in the U.S.
Globally:
- UK lifted retail bans
- Luxembourg allocated 1% of sovereign fund to BTC ETFs
- Pakistan and Czech Republic explored national BTC reserves
Crypto ETPs are rapidly becoming the default global investment wrapper for digital assets.
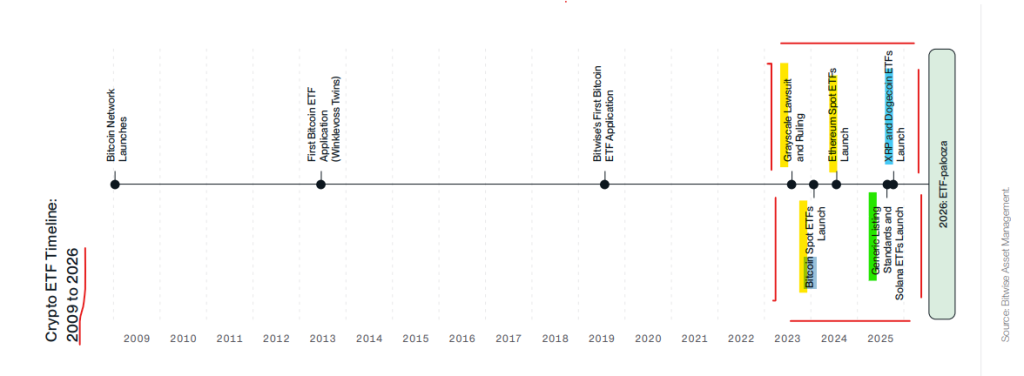
ETF Approval Timeline
For over a decade, the SEC rejected crypto ETFs. However, after a court ruling, they allowed bitcoin ETFs to launch in January 2024, followed by Ethereum ETFs six months later. In October 2025, the SEC published standard listing rules for crypto ETFs, leading to the launch of Solana ETFs (with staking) that quickly attracted over $600 million. This was soon followed by XRP, Dogecoin, and Chainlink products.
6. DeFi: On-Chain Finance in 2025
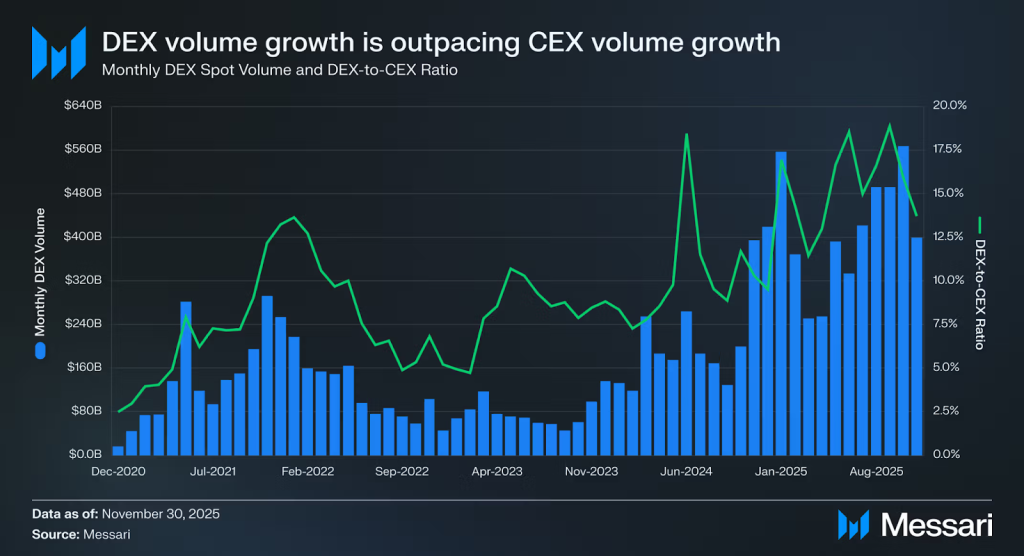
Decentralized finance continued its structural advance in 2025, with decentralized exchanges (DEXs) capturing a growing share of global spot trading activity. Year-to-date, DEX volumes reached $4.53 trillion, equivalent to 16% of centralized exchange (CEX) volumes, which totaled $29.04 trillion. This marked the third consecutive year in which DEX volume growth outpaced that of CEXs, up from 10% in 2024 and 8% in 2023.
Daily activity reinforced this trend. Average daily spot DEX volume increased from $7.04 billion in 2024 to $13.51 billion in 2025, representing a 92% year-over-year increase. Activity peaked during periods of heightened speculation and volatility, including January’s memecoin surge which briefly setting a monthly record of $556.52 billion and again in October, when volumes climbed to $563.74 billion amid the largest deleveraging event recorded on October 10, 2025.
Shifting Blockchain Market Share
Ethereum no longer dominates on-chain spot volume as it did in prior cycles. Over the last three months of 2025, Solana (26%) and BNB Chain (20%) emerged as the leading venues for spot DEX trading.
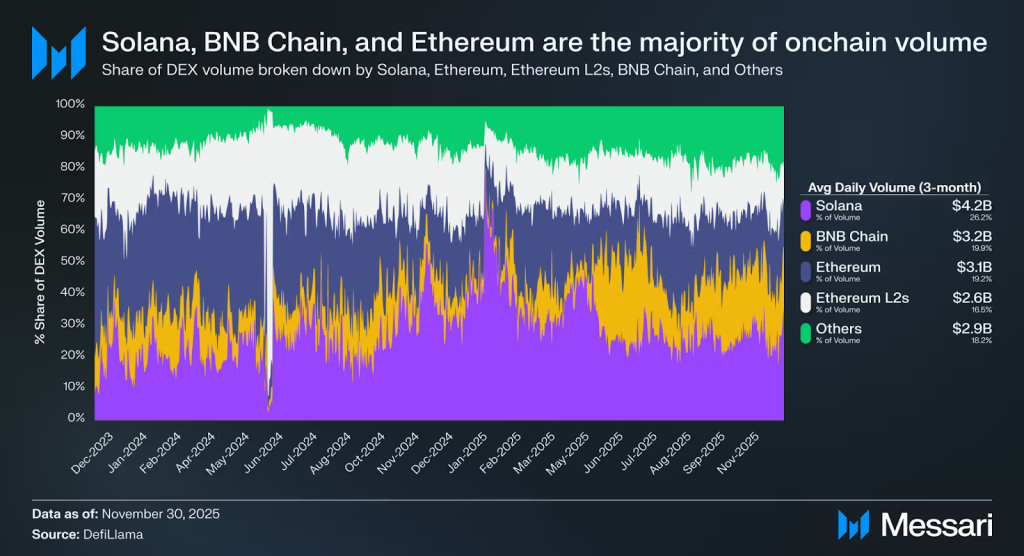
In 2024, spot DEXs averaged a 36% daily turnover rate. In 2025, turnover nearly doubled to 63%, meaning each dollar of liquidity supported almost twice as much trading activity. This increase was primarily driven by lower transaction costs and improved blockchain scalability, which expanded the universe of economically viable arbitrage and microstructure strategies.
Leading DeFi Tokens
Excluding major base assets such as ETH, SOL, and BNB, the leading DeFi-native tokens by relevance and activity in 2025 included:
- Uniswap
- Hyperliquid
- 1inch
- PancakeSwap
- Aerodrome
- Morpho
- Maple
7. Stablecoins and On-Chain Payments
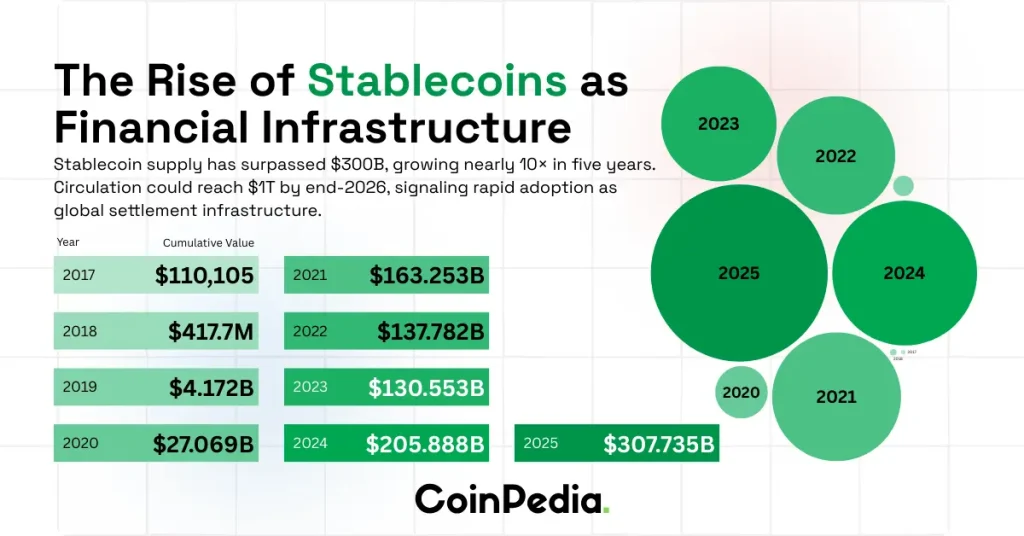
In 2025, stablecoins became the dominant growth vector across crypto and fintech. Nearly every major crypto company pivoted toward stablecoin-focused strategies, while traditional fintechs actively integrated stablecoins into remittances, treasury operations, and payments.
Remittances and Treasury Adoption
Large remittance providers including Remitly, Zepz, Western Union, and MoneyGram that announced stablecoin integrations, signaling a shift toward faster and lower-cost cross-border payments. At the enterprise level, multinational companies began using stablecoins for internal and partner transfers, with firms like Starlink and Stripe reportedly moving millions of dollars daily. Infrastructure providers such as Beam (Modern Treasury) and Rail (Ripple) were acquired to accelerate adoption.
Stablecoin Issuance and Market Expansion
Following 50% year-over-year growth in 2025, stablecoin supply is projected to double in 2026, exceeding $600 billion in AUM. Growth is expected to be driven primarily by platform-specific stablecoins including USDH, CASH, and PYUSD rather than general-purpose tokens. Issuance increasingly relies on institutional-grade platforms such as Bridge and Anchorage, contributing to a more democratized market structure.
Payments and Merchant Adoption
Stablecoins accounted for approximately 40% of BitPay’s total payment volume in 2025, up from 30% in 2024. Usage of USDC on BitPay increased 35% year-over-year, with stablecoins now widely used for retail purchases, vendor payments, affiliate payouts, and large settlements. Notably, 95% of stablecoin transactions on BitPay occurred on Ethereum and Layer-2 networks, with BitPay processing over 600,000 stablecoin transactions annually, primarily in USDT and USDC.

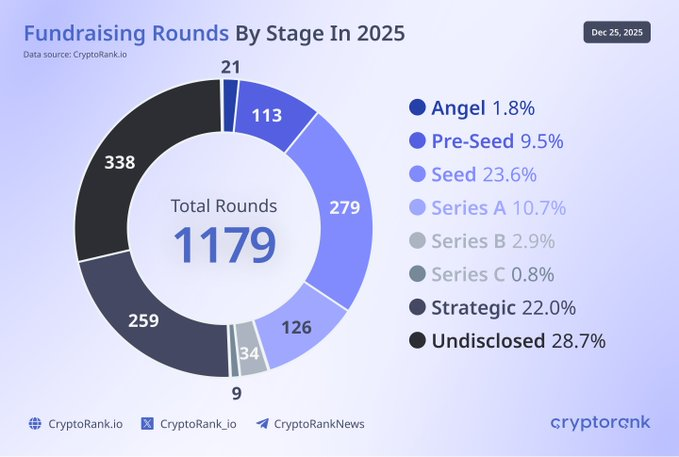
8. Crypto Fundraising: 1,179 Rounds in 2025
The crypto fundraising sector experienced significant growth in 2025, with notable changes in investor behavior reflected in the ongoing capital deployment in Web3 projects. According to CryptoRank, undisclosed funding rounds led the market, accounting for 28.7% of the total 1,179 funding rounds.
Seed funding rounds followed, making up 23.6% with 279 rounds, while strategic rounds accounted for 22.0% with 259 rounds. Series A rounds comprised 10.7% with 126 rounds, and pre-seed rounds represented 9.5%.
In contrast, Series B funding rounds held a 2.9% share, angel rounds reached 1.8%, and Series C rounds accounted for just 0.8%. Overall, the increase in funding across the crypto market indicates growing investor confidence despite market volatility.
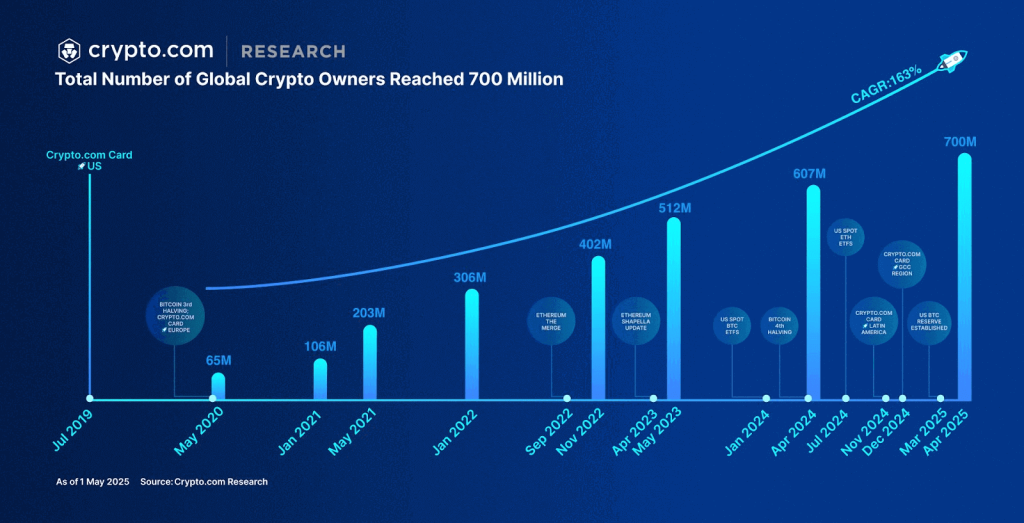
9. Global Crypto Adoption in 2025
Crypto adoption in 2025 shifted decisively toward real-world utility. Regulatory clarity from frameworks such as MiCA in the EU and the GENIUS Act in the U.S., alongside spot Bitcoin and Ethereum ETFs, boosted institutional trust and drove a 50% increase in U.S. transaction volumes.
Key global adoption statistics include:
- 580 million global crypto owners (up from 562m in 2024 and 420m in 2023)
- 34% year-over-year growth in ownership
- 55% of new users onboard via fintech and mobile banking apps
- 38% cite fiat on-ramps as the largest barrier to entry
- 41% cite off-ramp speed as the biggest unmet need
- 74% of institutional investors plan to increase digital asset exposure in 2025
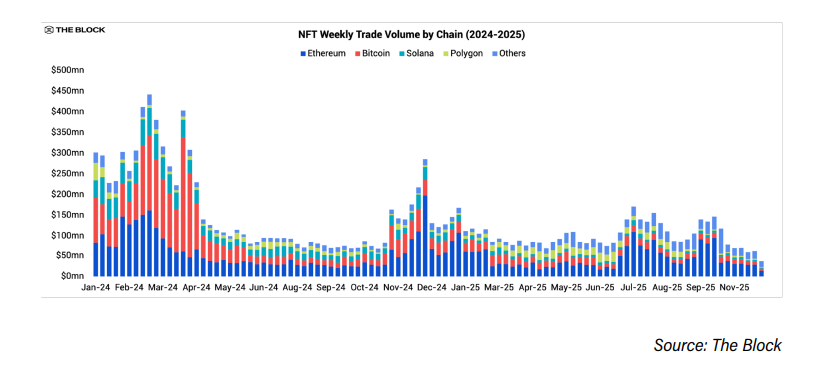
10. NFTs, Gaming, and Digital Ownership
NFT markets continued to contract in 2025. Total annual NFT trading volume declined to $5.5 billion, significantly below 2024 levels. Activity became increasingly concentrated on Ethereum and a small number of high-profile intellectual properties.
Market share shifted sharply among platforms. By late 2025:
- OpenSea exceeded 67% market share, with over $1.4 billion in annual volume
- Blur’s volume declined over 73%, with market share falling below 24%
A notable development was the issuance of fungible ecosystem tokens by leading NFT brands:
- Pudgy Penguins (PENGU)
- Doodles (DOOD)
- Azuki (ANIME)
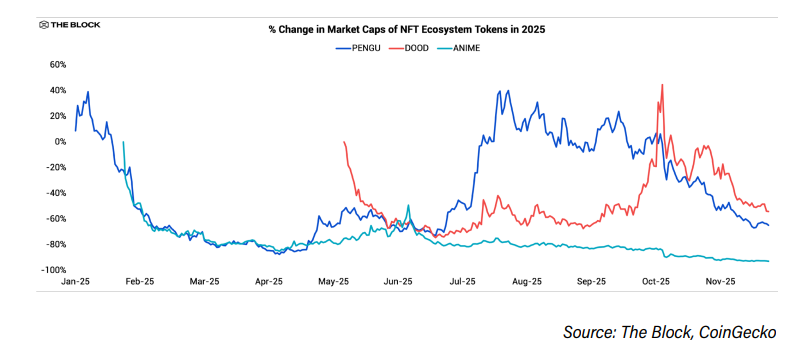
These launches aimed to expand liquidity and engagement beyond static NFTs, though price performance reflected the challenges of sustaining cultural token momentum.
11. Security, Hacks, and Crypto Crime
Crypto security deteriorated significantly in 2025, with total losses reaching approximately $3.4 billion, driven largely by a small number of major incidents.
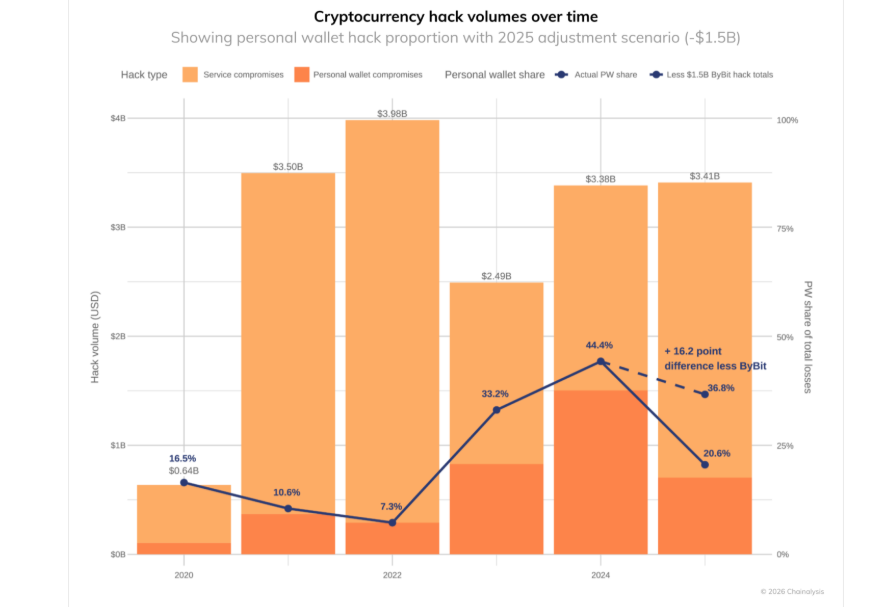
The Bybit Breach
On February 21, 2025, a $1.5 billion Ethereum theft marked the largest crypto hack on record. The attack exploited a supply-chain compromise, deceiving signers during a routine wallet transfer. ETH prices fell 15% within 48 hours, prompting widespread reassessment of multisig and signing practices.
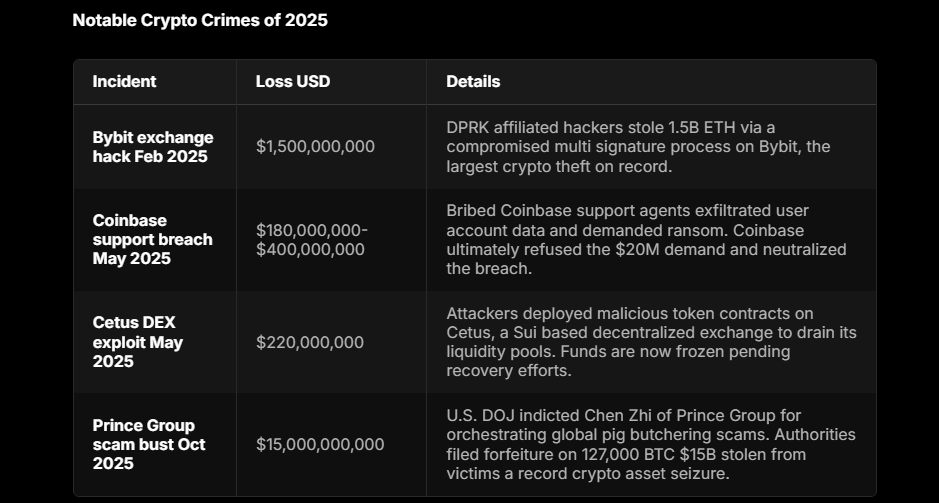
Law enforcement responses improved markedly. In October 2025, the U.S. DOJ seized $15 billion linked to a global scam network, while $40 million of Bybit funds were frozen within weeks.
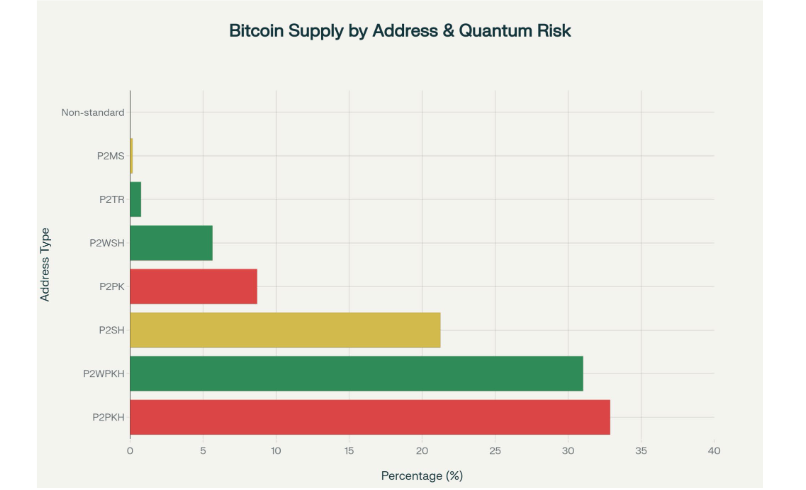
Emerging defenses emphasized quantum readiness, cryptographic diversification, and operational safeguards, including migration to Taproot addresses, hybrid post-quantum cryptography, and elimination of blind signing practices.
12. 2026 Outlook: Scenarios and Catalysts
The long-term outlook for digital assets in 2026 is underpinned by a widening imbalance between institutional demand and net new supply. Since the launch of spot Bitcoin ETFs in January 2024, these vehicles have collectively accumulated 710,777 BTC, absorbing a material share of circulating supply. This structural dynamic is expected to intensify.
In 2026, institutional access to crypto ETFs is set to expand further across jurisdictions and distribution channels. As a result, crypto ETFs are projected to purchase more than 100% of the annual net issuance of Bitcoin, Ethereum, and Solana, implying that incremental demand will increasingly need to be met through secondary market liquidity rather than new supply. This dynamic represents a fundamental shift from prior cycles, where speculative retail flows dominated marginal price action.
Prediction Markets Enter Their Second Act
Prediction markets emerged as one of the most unexpected breakouts of the previous cycle. In 2024, Polymarket reached a peak of $500 million in open interest during the U.S. presidential election before sharply retracing to approximately $100 million. While some market participants view this as cyclical election-driven activity, the underlying trajectory suggests otherwise.
By 2026, Polymarket is expected to surpass its prior all-time high, driven by broader market diversification rather than reliance on a single political event. Activity has steadily expanded into sports, pop culture, crypto-native markets, and macroeconomic forecasting. With the U.S. midterm elections approaching and political engagement rising globally, the platform is positioned to operate at sustained, high utilization levels throughout the year.
Bitcoin’s Correlation Regime Shifts Lower
Bitcoin’s relationship with traditional equities remains structurally distinct. Analysis of rolling 90-day correlations shows that Bitcoin’s correlation with the S&P 500 has rarely exceeded 0.50, the commonly accepted boundary between low and medium correlation.
Looking ahead to 2026, this correlation is expected to decline further relative to 2025. The primary driver is the increasing dominance of crypto-specific catalysts like regulatory clarity, ETF inflows, institutional adoption, and onchain financial activity.These drivers were at a time when equity markets face headwinds from valuation constraints and slowing near-term economic growth. This divergence reinforces Bitcoin’s evolving role as a macro-uncorrelated asset rather than a leveraged proxy for risk equities.
Stablecoins Move From Breakout to Infrastructure
Stablecoins experienced a decisive breakout in 2025. Outstanding supply reached $300 billion, while monthly transaction volumes averaged $1.1 trillion over the six months ending in November. The passage of the GENIUS Act and sustained institutional capital inflows further legitimized the sector.
In 2026, the focus shifts from adoption to utility at scale. Stablecoins are expected to:
- Integrate directly into cross-border payment networks
- Serve as collateral on derivatives and futures exchanges
- Appear on corporate balance sheets for treasury management
- Compete with credit cards in online consumer payments
The continued rise of prediction markets is also likely to create incremental stablecoin demand. Higher transaction volumes should directly benefit the blockchains that settle these payments including Ethereum, Tron, BNB Chain, and Solana as well as key infrastructure and DeFi protocols such as Chainlink.
Tokenization: The Next Structural Shift
While stablecoins demonstrated clear product-market fit in 2025, they represent only the opening chapter of a broader transformation. The next phase of crypto adoption will be defined less by speculative trading and more by the digitalization of financial infrastructure, with tokenization at its core.
As the narratives of digital gold (Bitcoin) and digital dollars (stablecoins) mature, they are laying the foundation for large-scale migration of traditional assets onto blockchains. Bitcoin continues to anchor the hard-money thesis amid global monetary debasement, while stablecoins increasingly link banks, corporations, and consumers through real-time settlement.
Together, these systems establish the credibility, liquidity, and settlement rails required for tokenized real-world assets (RWAs) to scale meaningfully in 2026. As cash becomes tokenized, it is logical to expect that those digital dollars will seek yield-bearing and investment opportunities, creating a direct bridge between digital money and digital capital markets.
AI Shifts From Automation to Economic Amplification
The most compelling AI-driven businesses are no longer focused solely on cost reduction or task automation. Instead, they are amplifying the core economics of their customers. In contingency-based legal models, for example, firms only earn revenue when cases are won. AI platforms such as Eve leverage proprietary outcome data to improve case selection, increase win rates, and expand client capacity.
This represents a structural shift in software value creation. AI systems increasingly align with customer incentives, driving revenue growth rather than incremental efficiency gains alone. In 2026, this model is expected to proliferate across industries, creating compounding advantages that legacy software platforms will struggle to replicate.
13. Investment Implications & Asset Class Winners (2026)
The investment landscape heading into 2026 reflects the maturation of a truly multichain crypto economy. In 2025, infrastructure providers such as Dune onboarded more than 40 new networks, expanding coverage to 100+ chains. This rapid expansion did not merely reflect experimentation; it underscored the industry’s shift toward specialization, composability, and ecosystem-level differentiation.
Rather than a single dominant chain, 2025 highlighted how value accrues to networks that combine distribution, cost efficiency, regulatory alignment, and real economic throughput. The ecosystems below represent the clearest examples of where adoption, capital, and application-layer activity converged positioning them as potential beneficiaries in 2026.
High-Growth Ecosystems to Watch
Abstract
Abstract emerged as a standout consumer-focused ecosystem in 2025, driven by wallet adoption and gaming-native engagement. The Abstract Global Wallet (AGW) surpassed 3.3 million deployments, making it one of the most widely adopted smart contract wallets in the market.
Gaming acted as the primary growth catalyst. GigaVerse, winner of the Games’ Choice Award at the GAM3 Awards 2025, generated 550 ETH in marketplace volume, demonstrating sustained on-chain player engagement. Beyond gaming, Abstract attracted mainstream brands, including Red Bull, which launched its “In the Moment” digital collectibles series to commemorate key moments from the 2025 Formula 1 season.
Arbitrum One
Arbitrum One reinforced its position as a leading Ethereum Layer 2 by attracting sustained capital and institutional-grade applications. Total Value Secured continued to climb, signaling deep trust in the network.
A defining development was the expansion of Robinhood Stock Tokens on Arbitrum, which evolved into a $10M+ on-chain equity rail enabling European users to access over 900 U.S. stocks and ETFs under the EU’s MiFID II framework. By October 2025, Arbitrum hosted $10.6 billion in stablecoin market cap, processing more than $150 billion in stablecoin volume.
Base
Base delivered one of the strongest usage metrics of the year, reaching 18.2 million daily transactions on November 18, 2025. Importantly, growth was paired with decentralization progress. Base entered Stage 1 of Vitalik’s decentralization framework, introducing permissionless fault proofs and a decentralized Security Council.
Performance improvements further strengthened the ecosystem. Flashblocks enabled near-instant transaction responsiveness ( 200 ms), while Coinbase launched a unified multi-chain web wallet integrating assets, NFTs, DeFi, trading, and creator tools. This is deepening Base’s role as the primary on-chain entry point for retail users.
Berachain
Berachain’s Proof-of-Liquidity (PoL) model emerged as a unique incentive-driven approach to ecosystem growth. In 2025, over $31 million in incentives were distributed, encouraging validator competition and liquidity provisioning.
Kodiak Perps became a flagship application, posting $600 million in 90-day trading volume, supported by PoL incentives and Orderly’s liquidity. User adoption accelerated rapidly, with 3.6 million active wallets since launch.
BNB Chain
BNB Chain remained one of the most economically active networks in 2025. In November, it averaged 2.4 million daily active addresses, accounting for 24% of daily active users across tracked chains.
DeFi expansion was led by Aster, a decentralized perpetuals exchange featuring MEV resistance, privacy-preserving order flow, and yield-bearing collateral. Aster surpassed $400 million in TVL and achieved trading volumes that exceeded competitors such as Hyperliquid.BNB Chain also saw RWA TVL exceed $800 million, reinforcing its position as a hub for tokenized assets and on-chain credit. A 95% reduction in base gas fees materially improved accessibility, while the chain captured 79.3% of DEX trading volume at its peak in June 2025.
Bitcoin DeFi & Modular Ecosystems (BOB, Boba, Celo, Flare, Fuel)
- BOB expanded Bitcoin DeFi, reaching $152 million in TVL, with 733 BTC deployed via Solv Protocol, making it the fourth-largest Solv-supported network.
- Boba achieved rapid user growth, peaking near 22,000 DAUs in October. Lynx, its gasless perps DEX, generated $683 million in combined trading volume, accounting for a significant share of ecosystem activity.
- Celo became the leading transport layer for native USDT, scaling daily USDT transactions from 1 million to 6 million in under a year. Mento’s local-currency stablecoins processed $5.6 billion across 5.3 million transactions.
- Flare emerged as the dominant XRPFi ecosystem, with 60M+ FXRP locked and $124 million TVL, 80% allocated to DeFi use cases.
- Fuel Network posted one of the sharpest usage inflections, with daily transactions rising from under 100k to over 7 million, driven by Reactor DEX, which surpassed $120 million in cumulative volume.
Asset Class Winners by Theme (2026)
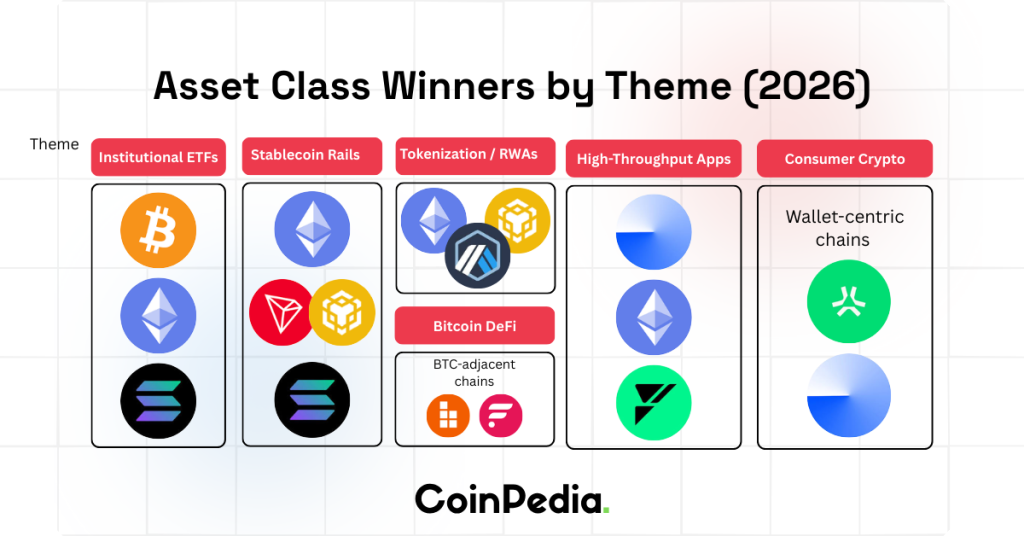
| Theme | Likely Beneficiaries |
| Institutional ETFs | BTC, ETH, SOL |
| Stablecoin rails | ETH, TRX, BNB, SOL |
| Tokenization / RWAs | ETH L2s, BNB, Arbitrum |
| Bitcoin DeFi | BTC-adjacent chains (BOB, Flare) |
| High-throughput apps | Base, Solana, Fuel |
| Consumer crypto | Wallet-centric chains (Abstract, Base) |
Strategic Implications for 2026
The market is no longer rewarding chains solely for narrative alignment. Capital is increasingly flowing toward ecosystems that demonstrate:
- Persistent on-chain economic activity
- Real-world integration (payments, equities, RWAs)
- Scalable, low-cost execution
- Regulatory compatibility
As crypto transitions from speculative cycles to financial infrastructure, asset performance in 2026 is likely to be driven less by beta and more by differentiation.
Never Miss a Beat in the Crypto World!
Stay ahead with breaking news, expert analysis, and real-time updates on the latest trends in Bitcoin, altcoins, DeFi, NFTs, and more.
Trust with CoinPedia:
CoinPedia has been delivering accurate and timely cryptocurrency and blockchain updates since 2017. All content is created by our expert panel of analysts and journalists, following strict Editorial Guidelines based on E-E-A-T (Experience, Expertise, Authoritativeness, Trustworthiness). Every article is fact-checked against reputable sources to ensure accuracy, transparency, and reliability. Our review policy guarantees unbiased evaluations when recommending exchanges, platforms, or tools. We strive to provide timely updates about everything crypto & blockchain, right from startups to industry majors.
Investment Disclaimer:
All opinions and insights shared represent the author's own views on current market conditions. Please do your own research before making investment decisions. Neither the writer nor the publication assumes responsibility for your financial choices.
Sponsored and Advertisements:
Sponsored content and affiliate links may appear on our site. Advertisements are marked clearly, and our editorial content remains entirely independent from our ad partners.