- Shubham Vishwakarma
 Shubham Vishwakarma
- Feb 28, 2026 09:43 UTC
-
XRP Price Rally Ahead? Key On-Chain Data and Technicals Say Yes
On-chain metrics and ETF inflows suggest selling pressure is fading, with buyer dominance and whale accumulation quietly building.
XRP’s price chart forms a cup-and-handle pattern, indicating a potential breakout in the near-term.
While the broader crypto market remains under pressure, attention is gradually shifting from fear to opportunity. As selling momentum fades across major assets, traders are increasingly focused on where the next reversal could begin. The XRP price rally narrative is now gaining traction in that context. Despite muted price action, a combination of on-chain accumulation, improving derivatives positioning, rising ETF inflows, and a constructive technical structure suggests that XRP may be approaching a structural bottom. The question now is whether XRP is quietly setting up for its next major move. Let’s take a closer look at what the on-chain data and charts are revealing.
XRP’s Taker Buy-Sell Ratio Shows Buyers Taking Control
One of the clearest short-term signals comes from the taker buy-sell ratio, which measures whether market participants are entering trades aggressively on the buy or sell side.
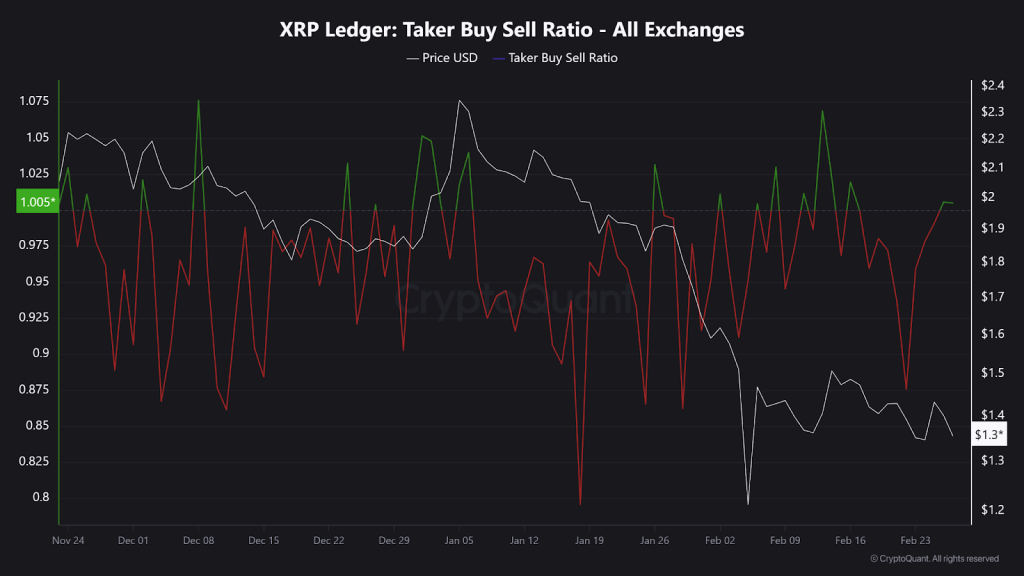
Recent data shows the ratio consistently holding above the neutral 1.0 level, with repeated readings in the 1.05–1.12 range. This indicates that buy market orders are dominating, a sign of active demand rather than passive accumulation. Crucially, this shift has occurred while price remains range-bound. Historically, XRP rallies have tended to begin after taker dominance builds quietly, not when price is already breaking out. The current setup suggests traders are positioning early rather than reacting late.
XRP’s Ledger Activity Confirms Network Engagement Is Holding Firm
Network data from the XRP Ledger reinforces the bullish undertone. Daily transaction counts have remained elevated, fluctuating between 2.1 million and 2.8 million transactions per day, even as price volatility compresses.
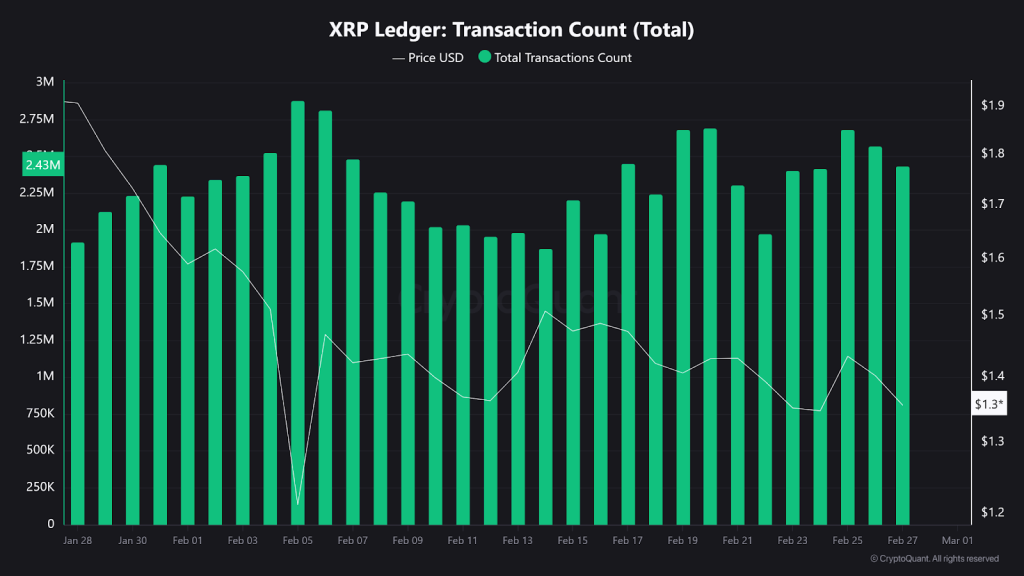
This divergence, rising or stable network usage during price consolidation, is typically associated with absorption phases, where demand builds without immediate price expansion. The persistence of ledger activity indicates that XRP’s ecosystem usage remains active, lending credibility to the argument that the current range reflects position-building rather than distribution.
Whale Accumulation Signals Strategic Positioning
Wallet distribution data adds further weight to the XRP price rally thesis. Addresses holding 10 million to 100 million XRP have shown net accumulation during recent pullbacks, while smaller retail-sized wallets remain largely neutral.
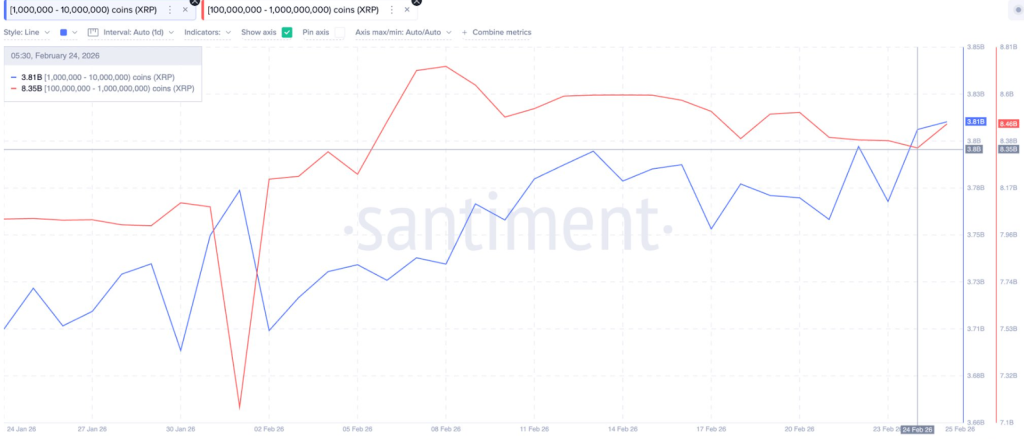
This pattern matters because large holders tend to accumulate during early-stage base formations, not during late-stage rallies. The absence of significant whale outflows also suggests that selling pressure at current levels is limited. In prior cycles, similar accumulation behavior preceded periods of volatility expansion rather than prolonged decline.
ETF Inflows Add Institutional Support
Another important layer supporting the XRP price rally thesis comes from spot XRP ETF flow data. Over the past week, XRP spot ETFs have recorded consistent positive inflows, with daily additions ranging from $1.2 million to $4.5 million. Cumulative net inflows now stand near $1.24 billion, while total net assets held across XRP ETFs remain stable around the $1.0–$1.06 billion range, despite broader market weakness.
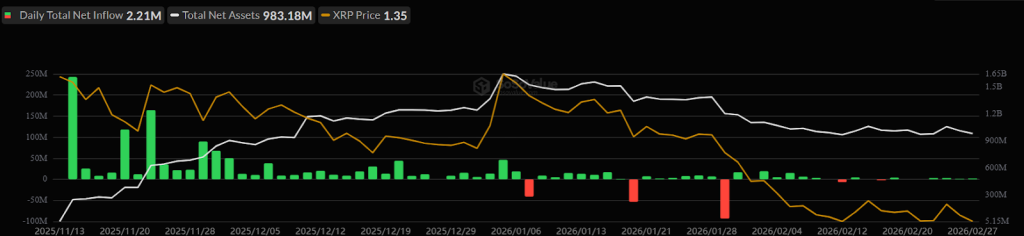
ETF inflows are particularly meaningful because they reflect longer-term institutional positioning, not short-term speculative trading. The fact that inflows are occurring during consolidation, rather than after a breakout, suggests early accumulation rather than momentum chasing.
XRP Price Analysis: Cup-and-Handle Pattern Takes Shape
XRP’s price chart is displaying a cup-and-handle pattern. The rounded base of the cup reflects a prolonged period of consolidation where selling pressure gradually weakened. This phase is typically associated with accumulation, as price stabilizes and volatility contracts. The current handle formation, a shallow pullback following the rounded recovery suggests controlled profit-taking rather than aggressive selling.
As long as XRP holds above the lower boundary of the handle near $1.20, the structure remains valid. A decisive breakout above the handle resistance, accompanied by volume expansion, would confirm the pattern and signal the start of a trend continuation move. Failure to break higher would likely result in extended consolidation rather than immediate downside, as the broader structure remains intact.
Final Thoughts
The developing XRP price rally thesis is increasingly supported by measurable data. Buyer aggression is improving, ledger activity remains strong, whales are accumulating, ETF inflows are rising, and a bullish chart structure is forming.
While confirmation still depends on a technical breakout, the evidence suggests XRP may be closer to a bottom than another leg lower. If broader market conditions stabilize, XRP appears structurally positioned to respond quickly when momentum returns.
FAQs
Yes. Rising buy pressure, whale accumulation, steady ledger activity, and ETF inflows suggest XRP may be forming a structural bottom.
Yes. Wallets holding 10M–100M XRP have increased holdings during pullbacks, a pattern commonly seen in early base-building phases.
Consistent ETF inflows reflect institutional accumulation, which can improve long-term stability and support future upside momentum.
XRP is down due to broader crypto market weakness, profit-taking near resistance, and short-term volatility despite steady on-chain demand.
Trust with CoinPedia:
CoinPedia has been delivering accurate and timely cryptocurrency and blockchain updates since 2017. All content is created by our expert panel of analysts and journalists, following strict Editorial Guidelines based on E-E-A-T (Experience, Expertise, Authoritativeness, Trustworthiness). Every article is fact-checked against reputable sources to ensure accuracy, transparency, and reliability. Our review policy guarantees unbiased evaluations when recommending exchanges, platforms, or tools. We strive to provide timely updates about everything crypto & blockchain, right from startups to industry majors.
Investment Disclaimer:
All opinions and insights shared represent the author's own views on current market conditions. Please do your own research before making investment decisions. Neither the writer nor the publication assumes responsibility for your financial choices.
Sponsored and Advertisements:
Sponsored content and affiliate links may appear on our site. Advertisements are marked clearly, and our editorial content remains entirely independent from our ad partners.