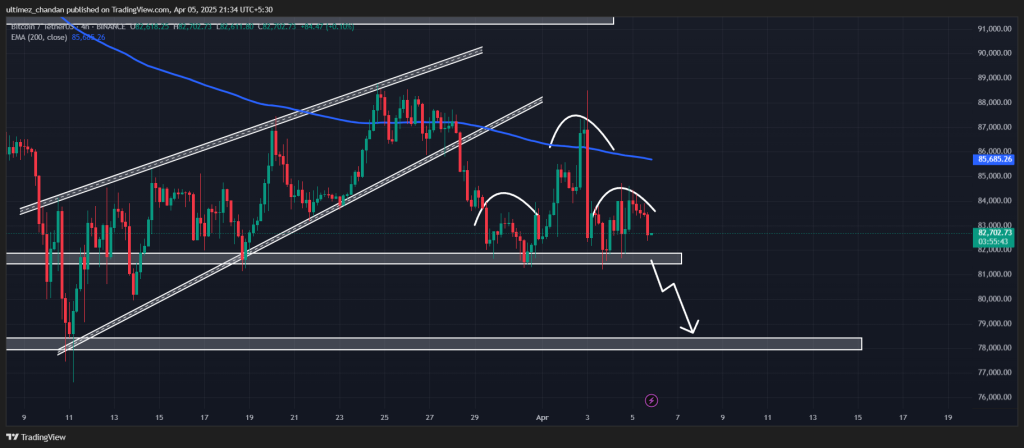
Amid the ongoing tariff war, Bitcoin (BTC), the world’s largest cryptocurrency by market cap, is poised for a massive price crash due to its bearish price action. In recent days, BTC appears to be consolidating within a tight range. However, upon closer examination, it seems to have formed a bearish head and shoulders pattern on the four-hour time frame.
Current Price Momentum
It seems like the market isn’t reacting to any positive news. Earlier, following Treasury Secretary Scott Bessent’s bold statement, BTC along with major assets began to rebound, but the upside momentum later faded and all gains were lost. Currently, BTC is trading near the $82,500 level and has recorded a price decline of over 1.10% in the past 24 hours. During the same period, its trading volume dropped by 50%, indicating lower participation from traders and investors due to notable market volatility.
Bitcoin (BTC) Technical Analysis and Upcoming Levels
According to expert technical analysis, with the recent price decline, BTC is heading toward the neckline of the bearish head and shoulders pattern.

Based on recent price action and historical patterns, if this momentum continues and BTC breaches the neckline at the $81,500 level, there is a strong possibility it could decline by 4% to reach the $78,200 level in the near future.
As of now, the asset is trading below the 200 Exponential Moving Average (EMA) on both the daily and four-hour time frames, indicating a strong downtrend and weak momentum.
Traders typically wait for a price jump to short the asset, which explains the recent price spike and subsequent drop within less than 24 hours.
$175 Million Worth of BTC Outflow
Despite the bearish outlook, investors and long-term holders seem to be accumulating the asset, as reported by the on-chain analytics firm Coinglass.

Data from spot inflow/outflow reveals that exchanges have witnessed an outflow of approximately $175 million worth of BTC over the past 24 hours. Such outflow during a bearish market sentiment suggests potential accumulation.
While this can create buying pressure and trigger an upside rally, it typically occurs during a bull run.


