- Mustafa Mulla
 Mustafa Mulla
Mustafa has been writing about Blockchain and crypto since many years. He has previous trading experience and has been working in the Fintech industry since 2017.
- May 28, 2025 13:58 UTC
-
Virtual Protocol (VIRTUAL) Breaks Key Resistance In Second Parabolic Rally, Targets $3.

Key Highlights:
- VIRTUAL has gained 89.89% in May, currently trading at $2.39 with MCap of $1.56B
- Futures Open Interest surged from $35M in April to $239M by May 9; now at $299M.
- Daily trading volume hit $2.14B on May 9, currently at $1.38B.
- Momentum remains strong. Trend is bullish, but traders should watch for signs of exhaustion near resistance.
- Price has surpassed the $2.20 breakout zone, signalling a strong continuation setup.
Virtuals Protocol (VIRTUAL) is regaining momentum, breaking above $2.20 in a renewed parabolic rally, with traders eyeing $3 as technicals lead, while ecosystem usage growth remains moderate.
VIRTUAL/USD Price Analysis: Second Parabolic Rally in Progress
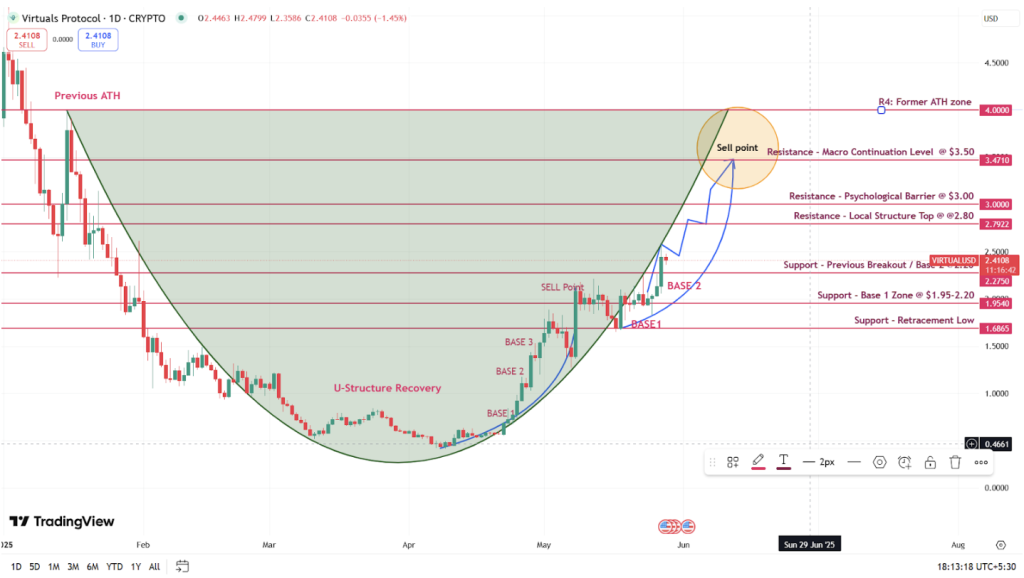
The April rally lifted VIRTUAL by 275%, from $0.60 to $2.25, forming three base structures before the vertical breakout. Since the May low of $1.68, VIRTUAL has formed another parabolic arc:
- Base 1: $1.95–$2.00 — initial consolidation.
- Base 2: $2.20 — breakout and continuation level.
The current price structure mirrors the first parabola, now approaching higher resistances. A U-shaped recovery from April to May has confirmed structural strength and dip buying.
Key Levels:
- Support Levels:
- $2.20 — Base 2 breakout zone.
- $1.95–$2.00 — Base 1 zone.
- $1.68 — retracement low from early May.
- Resistance Levels:
- $2.80 — local structure top.
- $3.00 — psychological breakout barrier.
- $3.50 — macro continuation level.
- $3.87–$4.00 — long-term ATH zone from January.
Growth Catalyst
Key Levels:
Support: $1.95–$2.00 (Base 1), $2.20 (Base 2), $1.68 (retracement low)
Resistance: $2.80 (local structure top), $3.00 (psychological breakout), $3.50 (macro continuation)
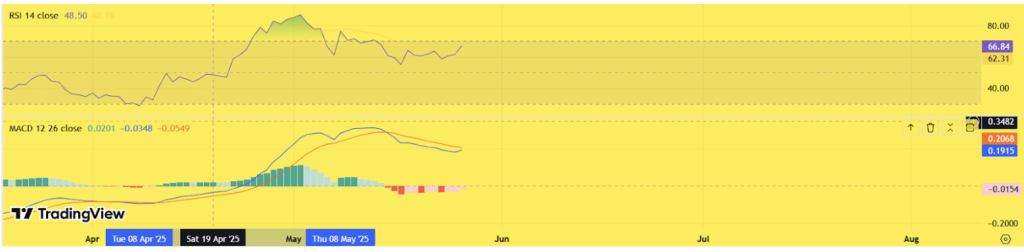
- RSI: 66.84 — showing strong bullish momentum nearing overbought levels.
- MACD: Flattening with a potential bullish crossover by early June, suggesting renewed upside strength.
Track the latest Virtuals Protocol price, market cap, and technical trends at Coinpedia Markets. Get real-time data, charts, and insights on the VIRTUAL coin
On-Chain Metrics: Speculative Strength Holds
Futures Open Interest:
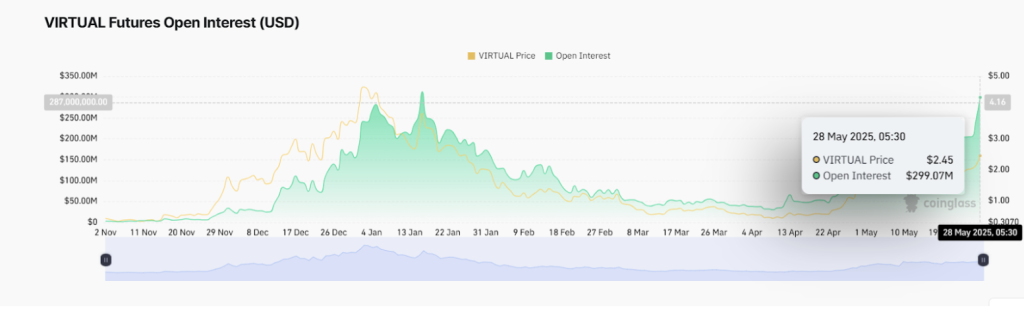
Futures open interest soared from $35.2M on April 11 (at $0.45) to $239.56M by May 9 ($2.09). As of May 28, open interest sits at $299.07M with price at $2.39 — just below its January high of $312.53M when VIRTUAL traded at $3.81. This shows rising leveraged positioning and speculative conviction.
Trading Volume:
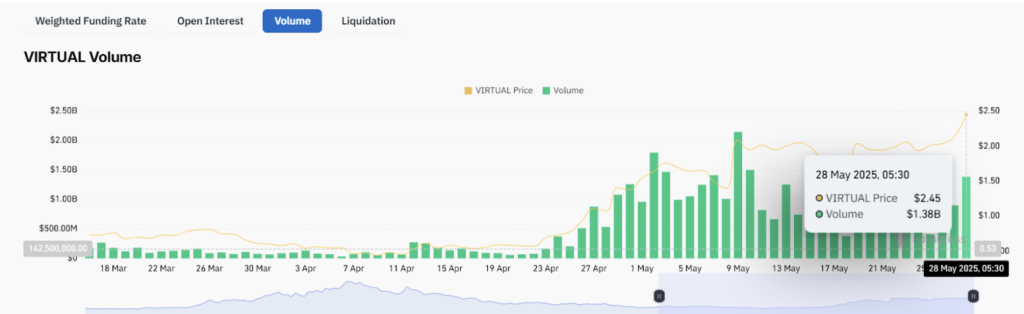
Volume peaked at $2.14B on May 9, then dipped to $1.11B on May 24. As of May 28, it has rebounded to $1.38B, showing renewed interest and sufficient liquidity for continuation.
Growth Catalysts Fueling the Rally
- Genesis Launchpad (April 17): Introduced a new token distribution mechanism, triggering fresh user interest and participation.
- Binance.US Listing (April 29): Significantly expanded trading access and improved liquidity through a top-tier exchange.
- Narrative Momentum: Branding as an AI-agent prediction protocol has attracted speculative attention from trend-focused traders.
- Influencer Engagement: Prominent crypto analysts highlighting VIRTUAL’s outperformance against ETH and SOL have boosted its visibility.VIRTUAL Price Prediction: Can Bulls Reach $3.00?
VIRTUAL Price Prediction: Can Bulls Reach $3 ?
VIRTUAL remains in a confirmed parabolic rally, supported by high open interest and strong volume. If price holds above $2.20 and breaks $2.80 with strength, the path toward $3.00 becomes likely. The current U-shaped recovery reflects a continuation of the macro trend.
Short-Term Forecast (May 29 – June 5):
- Possible short-term pullbacks to $2.35–$2.40.
- A revisit to $2.20 remains healthy within the arc structure.
- Breakout above $2.80 could send VIRTUAL to $3.00.
Mid-Term Outlook (June 5 – June 14):
- If $3.00 breaks with volume, next resistance is $3.50.
- Beyond that, $3.87–$4.00 becomes the macro breakout target.
The parabolic structure remains valid as long as $2.20 holds. Failure below this level could break the curve.