- Shrishesh Tanksalkar
 Shrishesh Tanksalkar
- Nov 17, 2025 08:48 UTC
-
Uniswap Price Shoots 18% in a week, Can Bulls Flip $8 and Claim $9.46?
UNI price spikes past key averages, $8 psychological level now in sharp focus
Daily trading jumps 48%, traders chase breakout in spot markets
$9.46 Fibonacci resistance presents the next major test for bullish momentum
I’ve watched Uniswap price light up trading screens this week, soaring 18.14%. All thanks to renewed protocol optimism and whale-driven momentum. Today’s 1.92% move builds on a strong reversal as governance chatter heats up around the Fee Switch Proposal. This drew traders who sense a fresh incentive alignment.
Successively, the technical rebound took off just as market sentiment hit extreme fear levels, adding fuel for a volatility surge. UNI’s price surging past short-term averages confirms that it’s not just noise, but a real bid from spot buyers.
While derivatives Open Interest dipped 8%, signaling less froth from leverage, conviction in spot seems to be what’s driving this rally. Join me as I decode the price targets for the near term.
UNI Bulls Eye $9.46, Volatility Ahead?
Let’s dive into UNI’s pure chart action. The UNI price reclaimed its 30-day SMA at $6.42, quickly powering through to knock on the door of the 200-day SMA at $7.94. This move marks the first clean reversal in weeks, with the MACD histogram crossing positive territory.
Now, that’s a classic momentum signal, telling me institutional players are returning to push trend-following algos higher. I see RSI-14 at 53.16, sitting comfortably above neutral yet steering clear of the overbought zone.
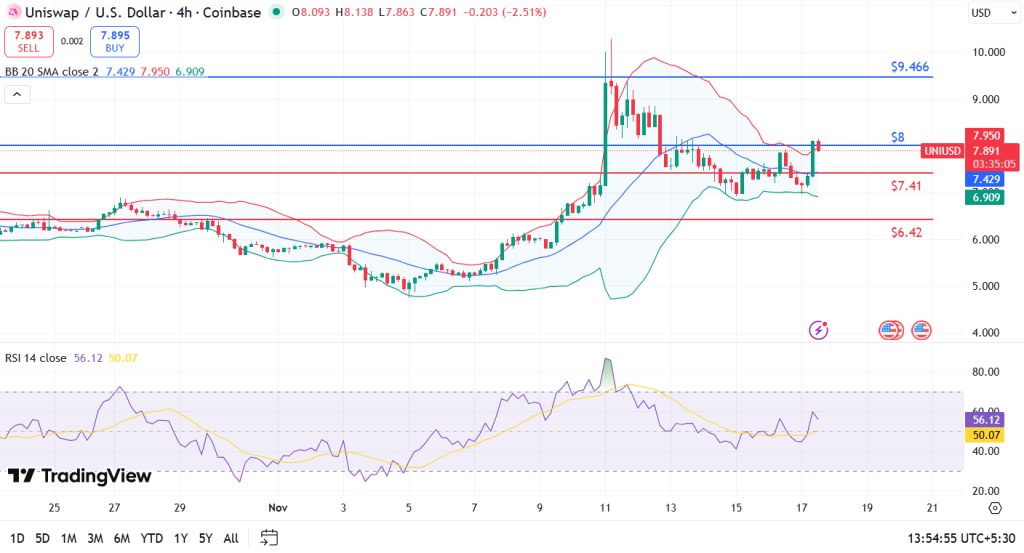
Successively, volume tells the next layer of the story. UNI’s 24h trading volume jumped a hefty 47.59%, up to $682 million. Wondering, when do targets get hit? If bulls can close a daily candle above $8, especially with volume holding above $650 million, the path to $9.46 opens wide. Based on current volatility, I expect a potential test of $9.46 within the next 7 to 10 days, with a sharp reversal in sentiment.
Conversely, if UNI fails to hold $7.41, sellers could retest the 30-day SMA around $6.42. However, negative momentum would likely stay capped unless RSI dips below 40 and volume drops back under $400 million. Bearish swings appear limited, since market structure shows strong historical support under $6.50. Successively, bullish conviction remains high unless volume fades or price closes below the weekly low of $7.07.
FAQs
Not yet. With RSI near 53 and away from the 70-mark, strength can persist before a reversal.
If $8 flips to support, $9.46 stands as the next technical resistance that could see profit-taking.
Volatility is high, so moves can cut both ways. Strong support exists above $6.42, minimizing crash risk unless volume collapses.
Trust with CoinPedia:
CoinPedia has been delivering accurate and timely cryptocurrency and blockchain updates since 2017. All content is created by our expert panel of analysts and journalists, following strict Editorial Guidelines based on E-E-A-T (Experience, Expertise, Authoritativeness, Trustworthiness). Every article is fact-checked against reputable sources to ensure accuracy, transparency, and reliability. Our review policy guarantees unbiased evaluations when recommending exchanges, platforms, or tools. We strive to provide timely updates about everything crypto & blockchain, right from startups to industry majors.
Investment Disclaimer:
All opinions and insights shared represent the author's own views on current market conditions. Please do your own research before making investment decisions. Neither the writer nor the publication assumes responsibility for your financial choices.
Sponsored and Advertisements:
Sponsored content and affiliate links may appear on our site. Advertisements are marked clearly, and our editorial content remains entirely independent from our ad partners.