- Chandan Gupta
 Chandan Gupta
- Mar 05, 2025 18:01 UTC
-
Time To Sell Uniswap? Whale Dumps $40 Million Worth UNI

Today, March 5, 2025, Uniswap (UNI) has registered an 8% price gain. However, it appears bearish and is poised for a decline, potentially due to a crypto whale dumping UNI tokens.
Whale Dump $40.60 Million Worth of UNI Tokens
Today, blockchain-based transaction tracker Lookonchain posted on X (formerly Twitter) that a prominent crypto whale, Galaxy Digital, deposited 600K UNI tokens worth $4.37 million onto Binance, the world’s largest cryptocurrency exchange.
However, the main concern driving fears of a price drop is that Galaxy has already deposited a significant 5.29 million UNI tokens worth $40.60 million on Binance and OKX over the past week.
Current Price Momentum
With all this, the asset is trading near $7.37, gaining 8% in the past 24 hours. However, during the same period, its trading volume dropped by 35%, indicating lower participation from traders and investors compared to the previous day. This decline was potentially caused by the sell-off and ongoing price fluctuations.
Uniswap (UNI) Price Action and Upcoming Levels
According to expert technical analysis, UNI appears bearish as it is already trading below the crucial support level of $8. With recent price fluctuations, it has retested this level and seems to be consolidating. Based on recent price action and historical patterns, if UNI fails to climb above the $8 level, it could drop by 25% to reach $5.50 in the coming days.
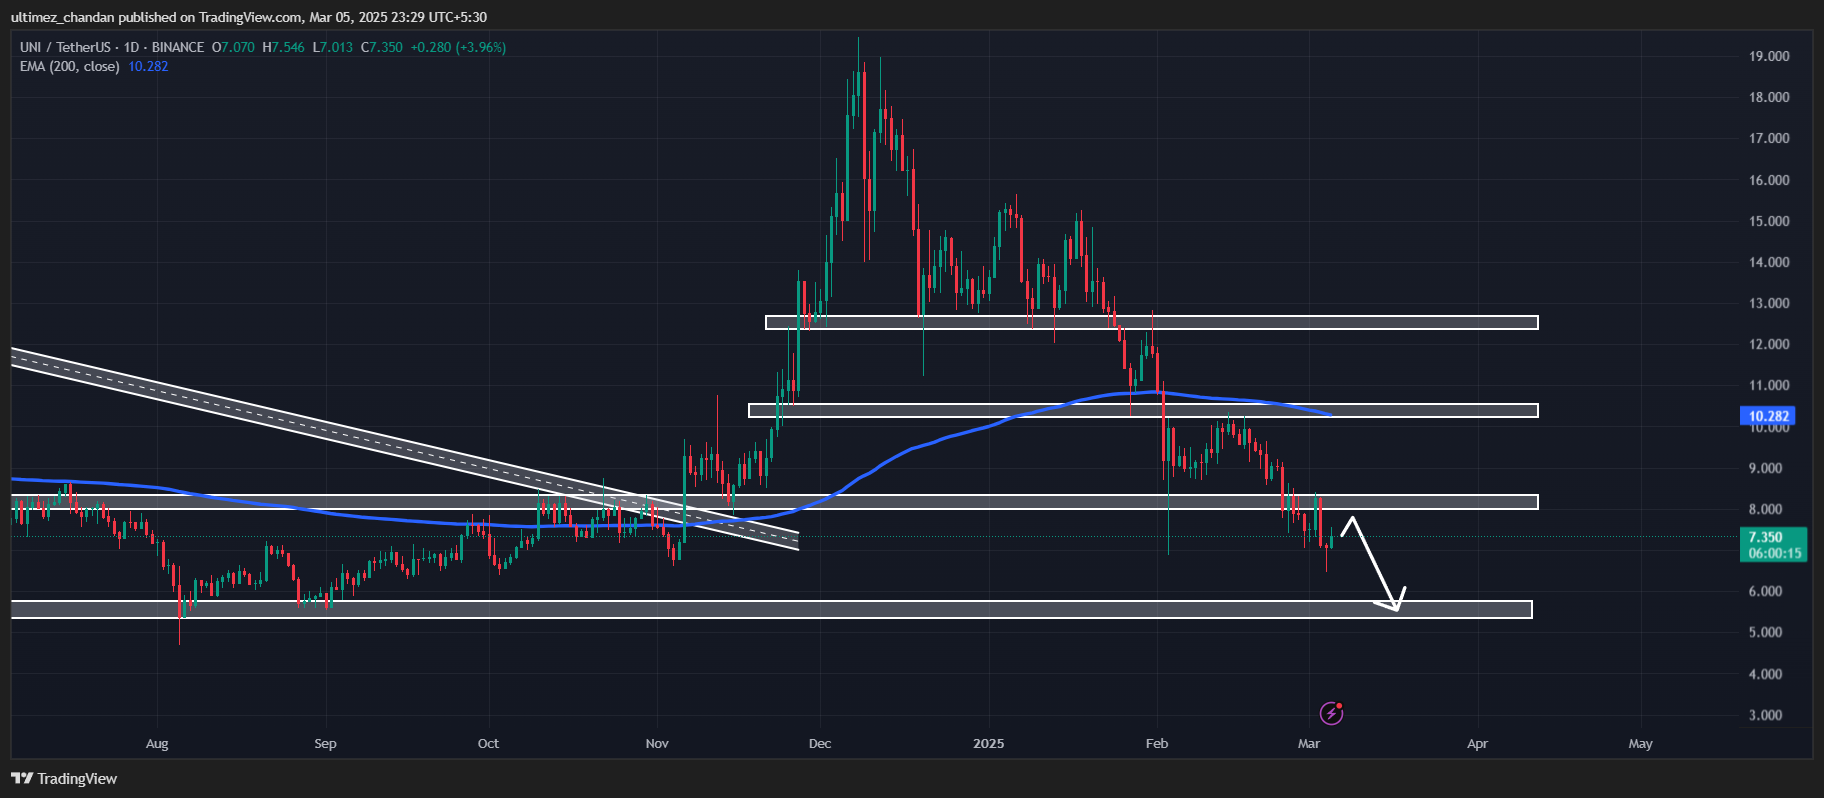
As of now, the asset is trading below the 200 Exponential Moving Average (EMA) on the daily timeframe, indicating a bearish trend. This technical indicator helps traders and investors determine whether the asset is in an uptrend or downtrend, allowing them to build their positions accordingly, either on the long or short side.
This ongoing dump by Galaxy Digital has the potential to increase selling pressure, further reinforcing the bearish outlook.