
 Advertise



TAO Price Analysis: The Crucial $245 Level That Decides Bittensor’s Next Move



Bittensor (TAO) has dipped 6% in the day amid wider market depression and high sell pressure.
At around $256, TAO trades between the upper resistance of $273 and support of $245.
An ascending staircase formation shows TAO could be setting up for a rally toward $273, then further to $300.
Lead peer-to-peer AI network Bittensor (TAO) has been caught in the wider market downturn, sliding 7% in the day to $256.60.
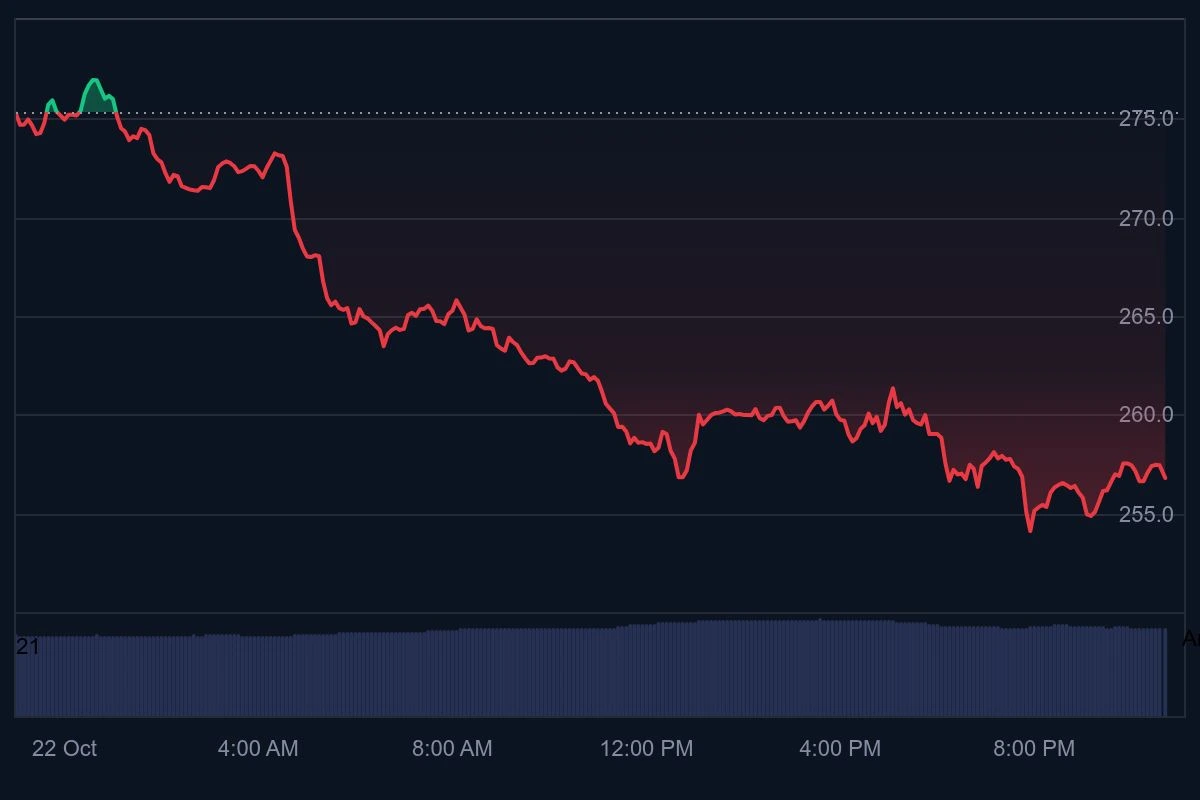
Source: CoinMarketCap
Technical analysis shows the $245 price as a crucial determinant in whether TAO will rally to $300 or plummet to $215 in the near term.
Bittensor (TAO) price analysis and prediction
At the current price of about $256, TAO is trading somewhat between its 50-day moving average (MA) of $273 and its 200-day MA of $245. These two indicators are now serving as the ceiling and floor, respectively.

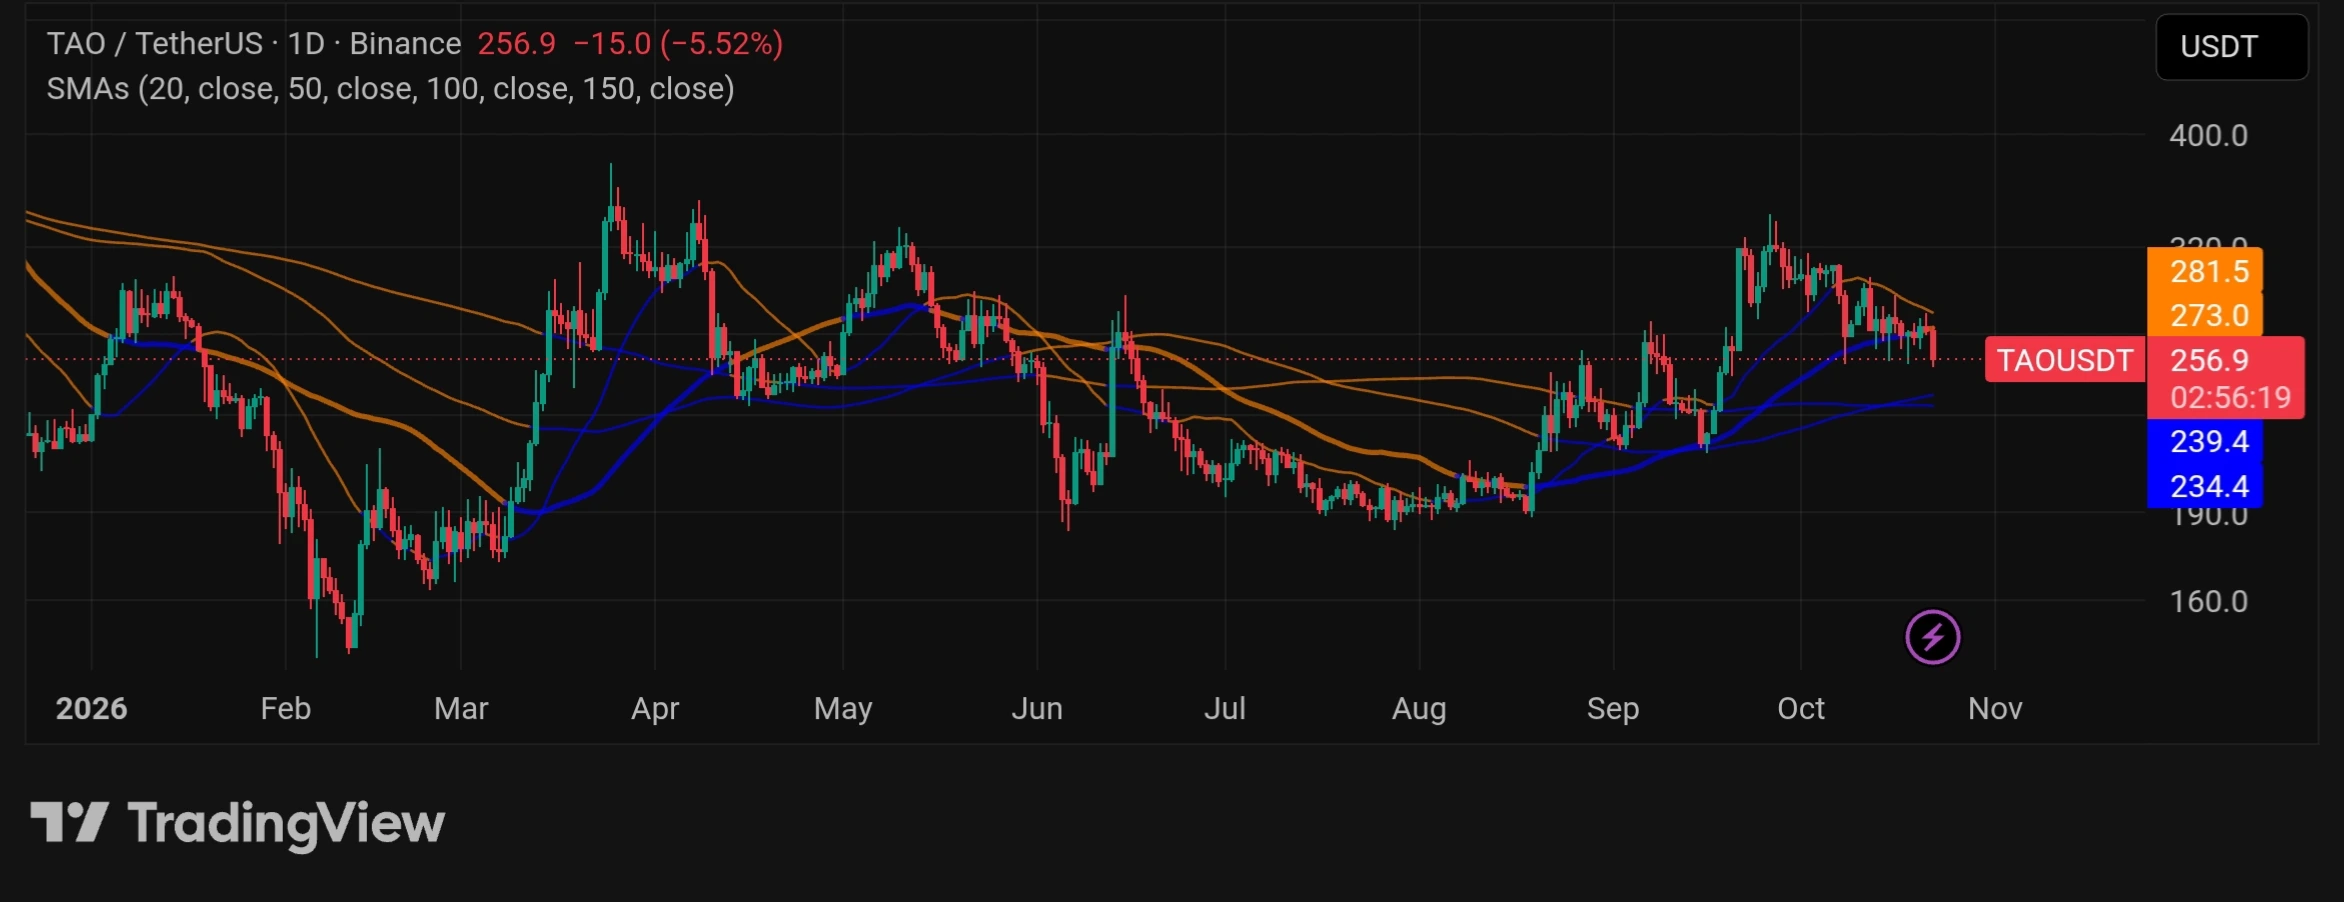
If TAO holds price in the $245-$255 range, it could climb to $273 and then further to $300 if it sustains positive momentum. This would prove that the initial drawback was just a shakeout of the weak hands in preparation for a higher move.
However, should TAO break below $245, then the October golden cross fails as it did in May. At this point, a pullback to the September low of $215 becomes highly likely.
The ascending staircase structure
Several indicators point to sellers currently dominating the Bittensor market.
The first is the sequence of lower highs made ever since the $340 top in late September. After $340, the next bounce peaked at $310, then at $290, then at $280. Such a pattern strongly suggests strengthening sell power.
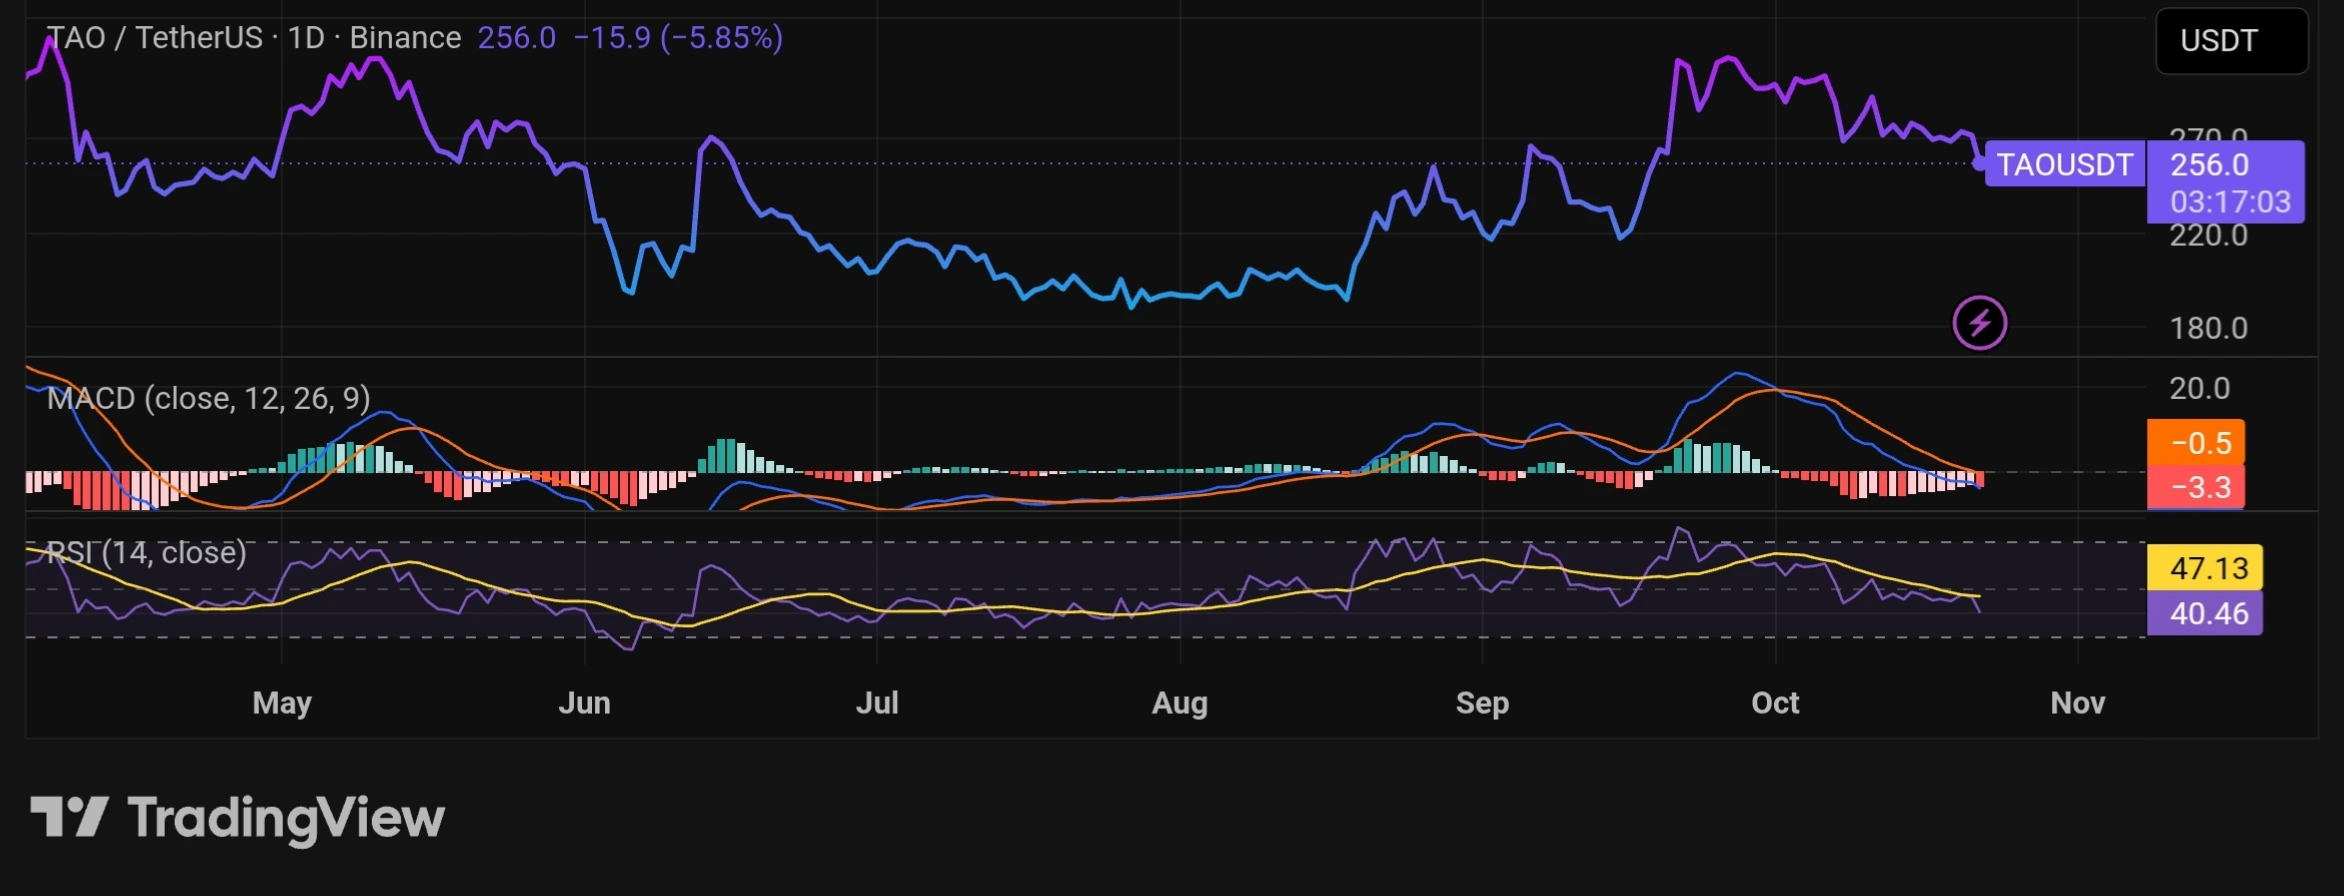
Supporting this are two momentum indicators – the Relative Strength Index (RSI) and the Moving Average Convergence Divergence (MACD). RSI has dropped to 40, which, while still in the neutral zone, shows buyer exhaustion. Echoing this is the MACD histogram, which continues to read a prolonged negative.
Nonetheless, a closer look shows an ascending staircase formation, with lows of $148, $185 and $215 for February, July and September respectively.
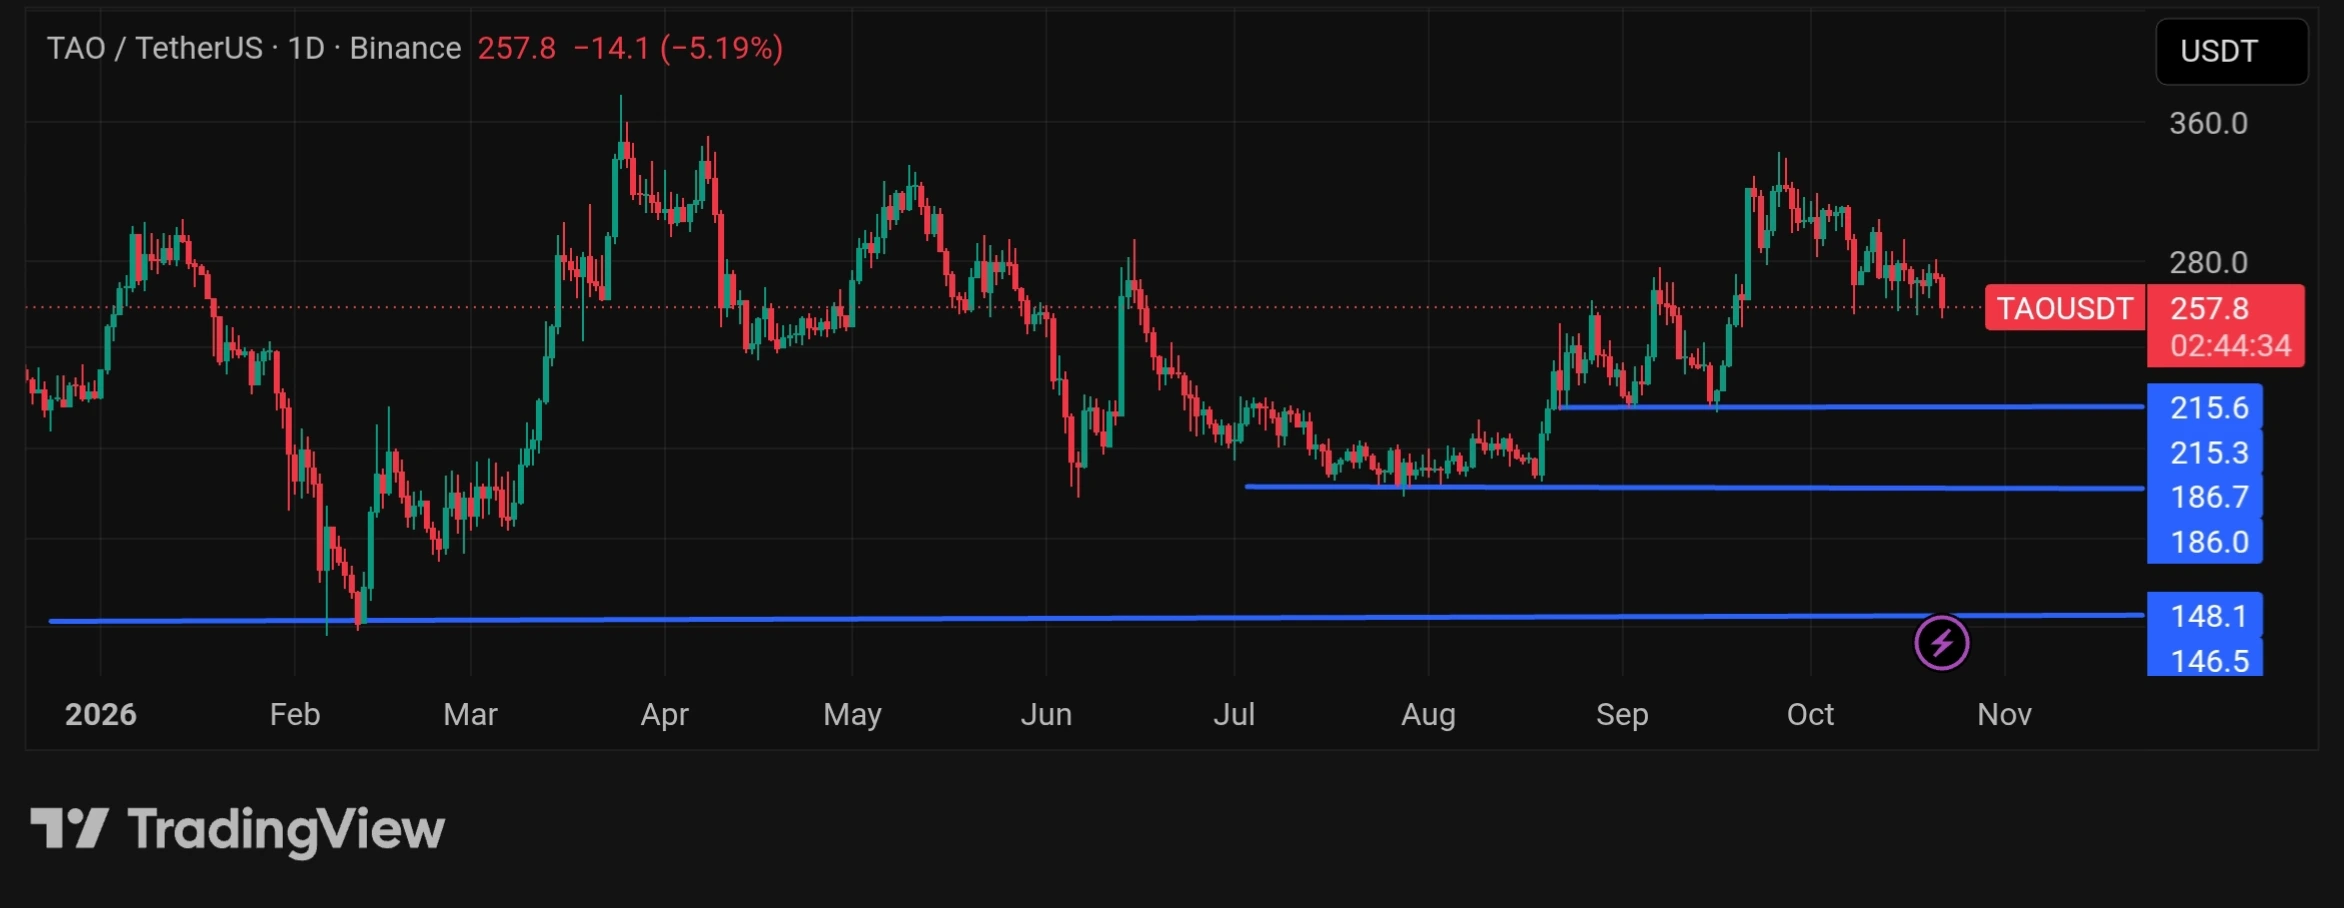
As long as prices don’t fall below the last step of $215, the long-term uptrend remains highly probable.
Was this writing helpful?

Trust with CoinPedia:
CoinPedia has been delivering accurate and timely cryptocurrency and blockchain updates since 2017. All content is created by our expert panel of analysts and journalists, following strict Editorial Guidelines based on E-E-A-T (Experience, Expertise, Authoritativeness, Trustworthiness). Every article is fact-checked against reputable sources to ensure accuracy, transparency, and reliability. Our review policy guarantees unbiased evaluations when recommending exchanges, platforms, or tools. We strive to provide timely updates about everything crypto & blockchain, right from startups to industry majors.
Investment Disclaimer:
All opinions and insights shared represent the author's own views on current market conditions. Please do your own research before making investment decisions. Neither the writer nor the publication assumes responsibility for your financial choices.
Sponsored and Advertisements:
Sponsored content and affiliate links may appear on our site. Advertisements are marked clearly, and our editorial content remains entirely independent from our ad partners.