- Sahana Vibhute
 Sahana Vibhute
- Dec 10, 2025 08:19 UTC
-
Solana Sell-Off Cools as SOL Price Defends Support—A Recovery Depends on This Level
Solana’s sell-off is losing momentum, with on-chain data showing cooling profit-taking and technicals pointing to stabilization rather than active distribution.
A recovery rally remains conditional, with SOL needing a daily close above the $145–$150 resistance zone to confirm a bullish reversal
Solana price is showing early signs of stabilization after weeks of persistent downside pressure, as both on-chain data and technical indicators point to cooling sell momentum. While the broader trend remains under pressure, traders are increasingly watching whether SOL can defend critical support levels and stage a recovery rally heading into year-end.
Solana On-Chain Data Signals Profit-Taking Is Cooling
On-chain metrics by Glassnode suggest that selling pressure may be easing. Solana’s Realized Profit/Loss Ratio, which tracks whether investors are selling tokens at a profit or a loss, has declined sharply after a recent spike. Historically, such cooling phases often mark the end of aggressive distribution periods rather than immediate trend reversals.
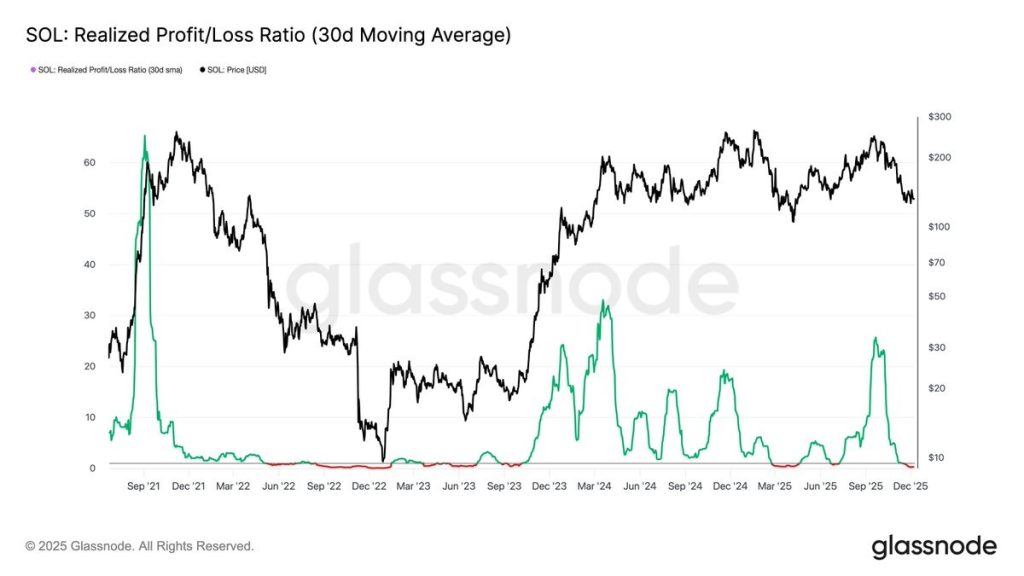
This shift indicates that many traders who bought lower have already locked in gains, reducing near-term sell pressure. While this does not guarantee higher prices, it creates conditions for consolidation, especially if spot demand begins to stabilize.
SOL Price Trades Inside a Descending Channel
From a technical perspective, SOL remains trapped inside a well-defined descending channel that has guided price action since late summer. However, recent price behavior suggests the downtrend is losing momentum.
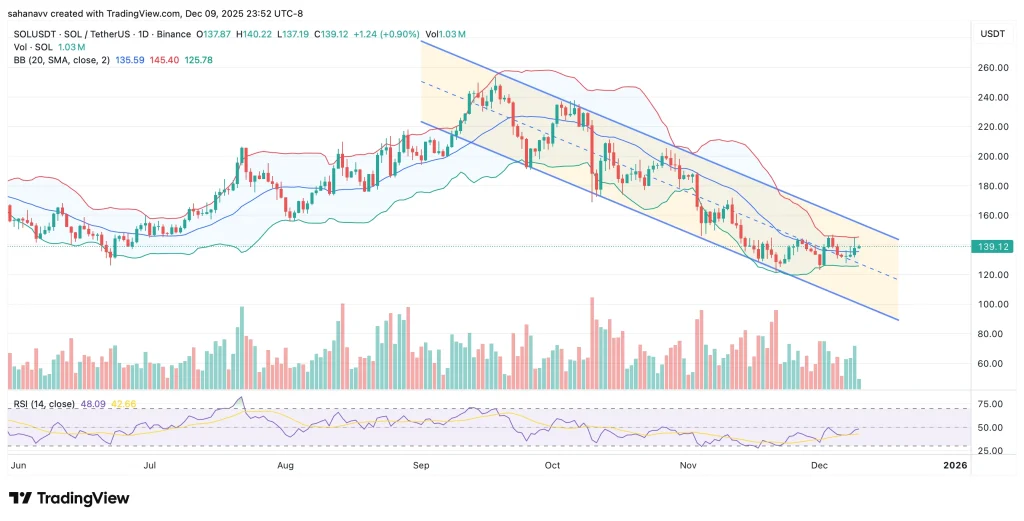
At the time of writing, Solana is trading near the $139 level—an area that aligns with the Bollinger Bands and has served as a short-term equilibrium zone in recent weeks. Holding above immediate support at $135 is crucial to prevent a continuation toward the channel’s lower boundary.
RSI and Bollinger Bands Suggest Stabilization
Momentum indicators support the idea of a slowdown in selling. The Relative Strength Index (RSI) has rebounded from oversold conditions and currently sits near 48, signaling neutral momentum. This range often precedes directional breakouts, particularly after extended sell-offs.
Meanwhile, Bollinger Bands are beginning to compress, hinting at reduced volatility. Such compression phases often resolve with sharp moves once the price breaks out of its range.
Key Levels That Could Define SOL’s Next Move
For bulls, reclaiming the $145–$150 resistance zone is critical. This region coincides with the upper Bollinger Band and descending channel resistance. A daily close above this area would signal a structural shift and could open the door to a recovery rally toward $155 and potentially $170.
On the downside, failure to hold $135 would weaken the stabilization narrative and expose SOL to a deeper pullback toward the $125 support zone.
Solana Price Outlook: Year-End and Early 2026
Solana’s sell-off appears to be cooling, but the trend has not yet reversed. On-chain data supports reduced selling pressure, while technical indicators suggest the market is transitioning into a consolidation phase. Whether this leads to a recovery rally into early 2026 depends on SOL’s ability to break above key resistance levels in the days ahead.
FAQs
According to our Solana price prediction 2025, the altcoin might chug up to a maximum of $400 by 2025.
As per our Solana price prediction 2030, with a potential surge, the price of SOL could reach a maximum of $1,351.
As per our latest SOL price analysis, Solana could reach a maximum price of $11,698.
By 2050, a single Solana price could go as high as $72,459.
Trust with CoinPedia:
CoinPedia has been delivering accurate and timely cryptocurrency and blockchain updates since 2017. All content is created by our expert panel of analysts and journalists, following strict Editorial Guidelines based on E-E-A-T (Experience, Expertise, Authoritativeness, Trustworthiness). Every article is fact-checked against reputable sources to ensure accuracy, transparency, and reliability. Our review policy guarantees unbiased evaluations when recommending exchanges, platforms, or tools. We strive to provide timely updates about everything crypto & blockchain, right from startups to industry majors.
Investment Disclaimer:
All opinions and insights shared represent the author's own views on current market conditions. Please do your own research before making investment decisions. Neither the writer nor the publication assumes responsibility for your financial choices.
Sponsored and Advertisements:
Sponsored content and affiliate links may appear on our site. Advertisements are marked clearly, and our editorial content remains entirely independent from our ad partners.