Sohrab Khawas

Sohrab Khawas

Author
Sohrab is a passionate cryptocurrency news writer with over five years of experience covering the industry. He keeps a keen interest in blockchain technology and its potential to revolutionize finance. Whether he's trading or writing, Sohrab always keeps his finger on the pulse of the crypto world, using his expertise to deliver informative and engaging articles that educate and inspire. When he's not analyzing the markets, Sohrab indulges in his hobbies of graphic design, minimal design or listening to his favorite hip-hop tunes.
- Aug 18, 2023 06:17 UTC
-
Bitcoin Price Analysis: BTC Price Falls To $26K, Breaks The Trendline in Focus!
BTC price action shows a drastic fall of 7% to break below the 200-day EMA.
Bitcoin price breaks the ascending trendline supporting the 2023 bull run.
The breakdown rally approaches the next support zone at $25K.
The crypto market leader, Bitcoin, sets a bearish tone for the market with a sharp 7% overnight fall. As per coin glass, the sudden bearish move liquidates around a billion dollars market-wide. With $855 Million in long positions suffering the sudden fall and $194 Million in short positions.
The largest liquidation is seen in Binance, the biggest crypto exchange as per trading volume. Centric to Bitcoin, liquidations in long positions account for $386 Million and $120 Million in short.

Before its downfall, Bitcoin price action maintained an uptrend with a solid support trendline. However, in a range breakdown with the bottom support at $29K, the falling BTC price breaks under the support trendline.
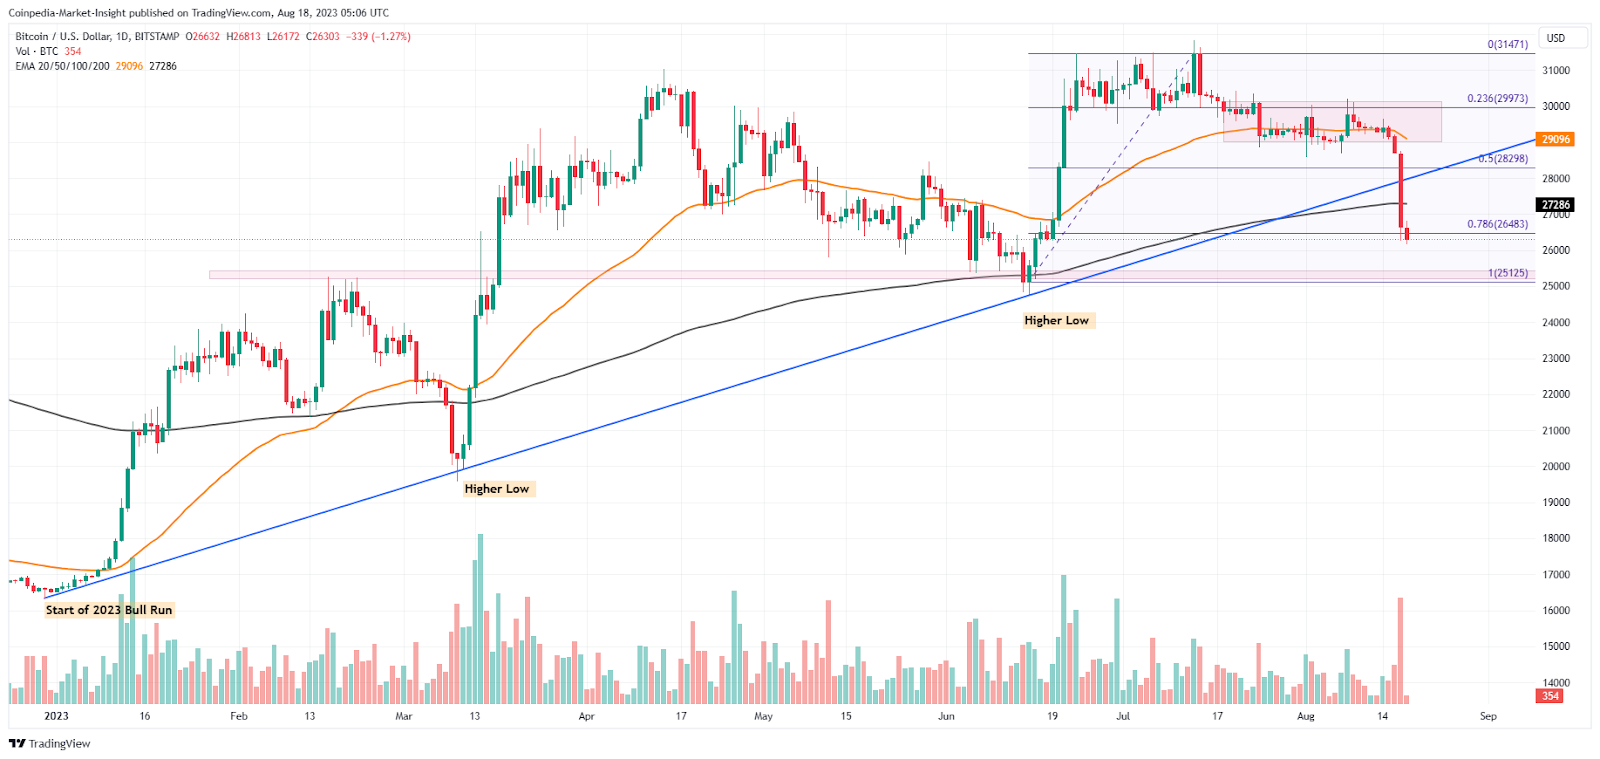
The spark in the daily trading volume with the 7% bearish candle clearly indicates a huge supply inflow. The downfall also breaks the 200-day EMA as the bearish influence grows. Currently, Bitcon price trades at $26473 with an intraday fall of 0.71%, challenging the bullish dominance at the 78.60% Fibonacci level.
The downtrend influences a down spike in the 50-day EMA and may lead to a deathcross if the downtrend continues or goes sideways.
The technical indicators like MACD and RSI line display a bearish picture. The bearish crossover with the rise in bearish MACD histograms aligns with the RSI line deep in the oversold zone.
Is Bitcoin Going To Crash To $20K?
Currently trading at $26K, the next crucial support zone for BTC price action is the $25K cushion. Apart from a psychological mark, the $25K holds a critical price action value in the Bitcoin chart. Therefore, with the $25K level standing strong, the chances of the BTC price reaching $20K are minimal.
On the flip side, if the Bitcoin market value plummets below the $25K support level, the downtrend will crash the BTC price drastically. Potentially retesting the $20K mark.