Chandan Gupta

Chandan Gupta

Author
- Mar 14, 2025 01:15 UTC
-
XLM Defies Market Crash, Poised for 65% Rally

XLM, the native token of Stellar, is gaining significant attention from crypto enthusiasts due to its impressive upside momentum amid bearish sentiment. On March 14, 2025, XLM recorded a price gain of over 5% in the past 24 hours, while Bitcoin (BTC) and Ethereum (ETH) saw price declines of 3.5% and 2%, respectively, during the same period.
XLM Current Market Momentum
With an impressive upside rally, XLM is currently trading near $0.27, having gained over 5% in the past 24 hours. However, during the same period, its trading volume surged by 75%, indicating heightened participation from traders and investors compared to the previous day.
Experts’ Comment on XLM
As the asset defies market trends, a prominent crypto expert posted on X (formerly Twitter) that XLM is forming a bullish flag and pole price action pattern, with the price currently near the lower boundary of the flag. Additionally, the expert noted that if XLM breaches the $0.42 level, it could rally to $1.60.
XLM Technical Analysis and Upcoming Levels
According to the expert’s technical analysis, XLM appears bullish as it has recently found crucial support at the $0.236 level and has begun gaining upside momentum. Additionally, the asset is forming a bullish flag and pole price action pattern. However, before breaking out of this pattern, if XLM holds above the $0.236 level, it could initially surge by 18% to reach $0.33 in the near future.
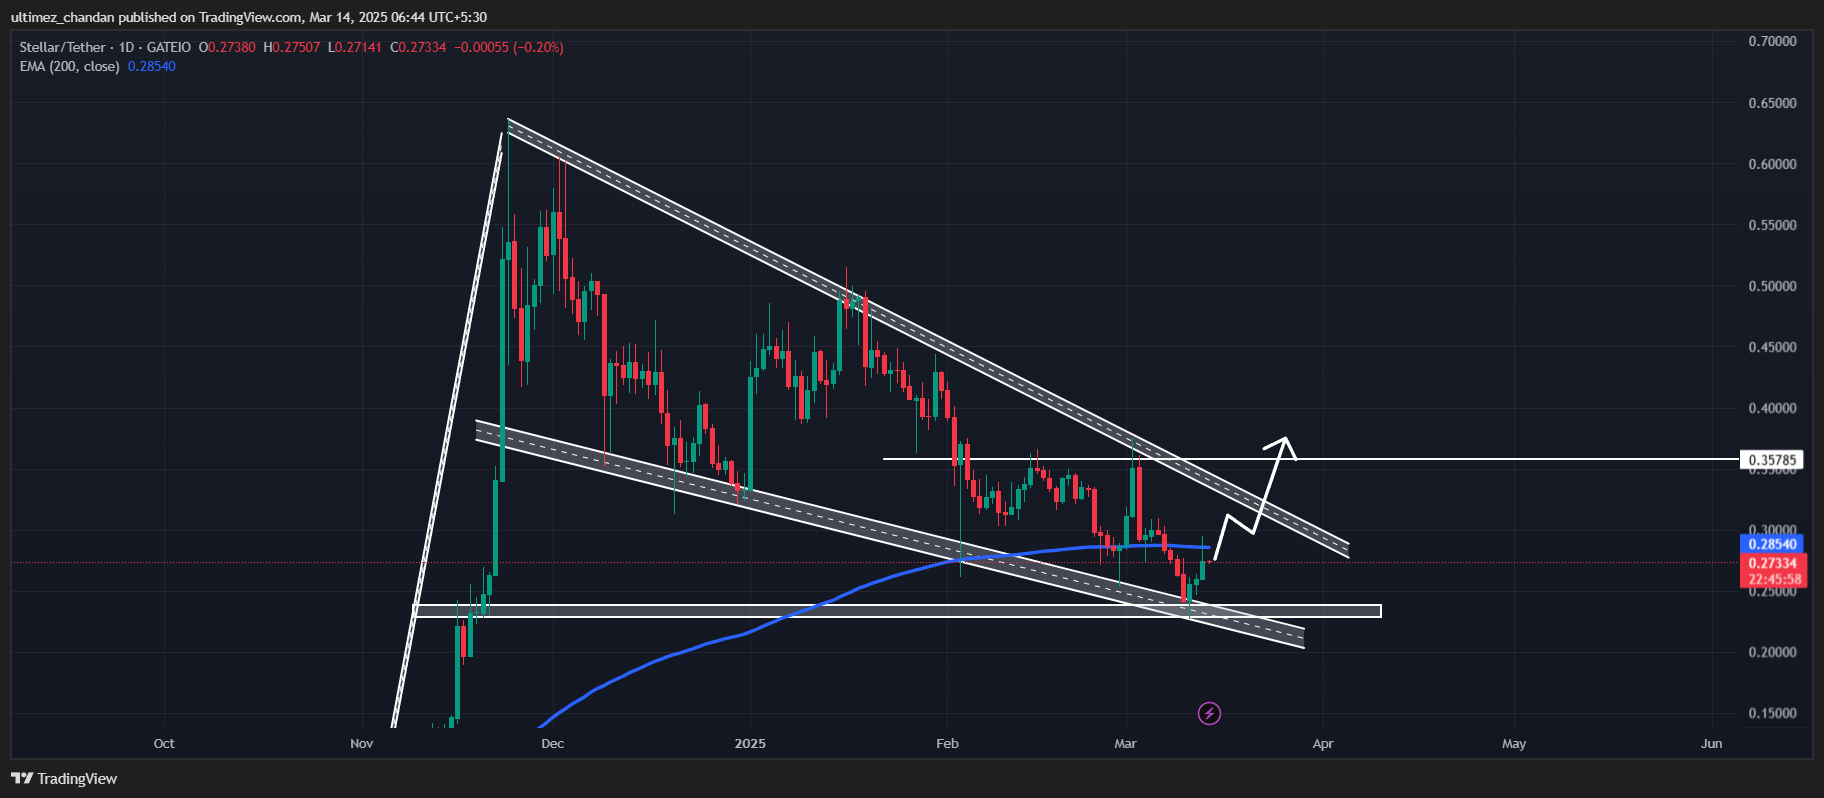
However, if the upside rally continues and the price closes a daily candle above the $0.35 level, there is a strong possibility of a 65% surge to reach the $0.605 level in the coming days. At press time, the asset is facing resistance from the 200 Exponential Moving Average (EMA) on the daily timeframe.
Major Liquidation Levels
With the current market sentiment, traders are heavily leveraged at $0.26 on the lower side, holding $3.02 million worth of long positions. Meanwhile, $0.285 is another over-leveraged level, where traders have built $2.65 million worth of long positions.
This data suggests that bulls betting on the long side remain optimistic and could be supporting the asset’s rally.